478 Fred Ash Rd Dahlonega, GA 30533
Estimated Value: $383,643 - $538,000
--
Bed
3
Baths
2,472
Sq Ft
$187/Sq Ft
Est. Value
About This Home
This home is located at 478 Fred Ash Rd, Dahlonega, GA 30533 and is currently estimated at $461,661, approximately $186 per square foot. 478 Fred Ash Rd is a home located in Lumpkin County with nearby schools including Lumpkin County High School.
Ownership History
Date
Name
Owned For
Owner Type
Purchase Details
Closed on
Aug 25, 2020
Sold by
Abernathy Alysha Leigh
Bought by
Abernathy Joshua
Current Estimated Value
Purchase Details
Closed on
Oct 1, 2014
Sold by
Abernathy Joshua
Bought by
Abernathy Joshua and Abernathy Aluysha Leigh
Home Financials for this Owner
Home Financials are based on the most recent Mortgage that was taken out on this home.
Original Mortgage
$185,948
Interest Rate
3.75%
Mortgage Type
FHA
Purchase Details
Closed on
Mar 28, 2012
Sold by
Abernathy Whitney
Bought by
Abernathy Joshua
Purchase Details
Closed on
Aug 28, 2009
Sold by
Abernathy Joshua Keith
Bought by
Abernathy Whitney D
Home Financials for this Owner
Home Financials are based on the most recent Mortgage that was taken out on this home.
Original Mortgage
$176,281
Interest Rate
5.11%
Mortgage Type
FHA
Purchase Details
Closed on
May 2, 2008
Sold by
Not Provided
Bought by
Abernathy Whitney D
Purchase Details
Closed on
Jul 1, 1979
Bought by
Abernathy B Stanley
Create a Home Valuation Report for This Property
The Home Valuation Report is an in-depth analysis detailing your home's value as well as a comparison with similar homes in the area
Home Values in the Area
Average Home Value in this Area
Purchase History
| Date | Buyer | Sale Price | Title Company |
|---|---|---|---|
| Abernathy Joshua | -- | -- | |
| Abernathy Joshua | -- | -- | |
| Abernathy Joshua | -- | -- | |
| Abernathy Whitney D | -- | -- | |
| Abernathy Whitney D | -- | -- | |
| Abernathy B Stanley | -- | -- |
Source: Public Records
Mortgage History
| Date | Status | Borrower | Loan Amount |
|---|---|---|---|
| Open | Abernathy Joshua Keith | $36,000 | |
| Open | Abernathy Joshua Keith | $166,448 | |
| Closed | Abernathy Joshua Keith | $167,070 | |
| Previous Owner | Abernathy Joshua | $185,948 | |
| Previous Owner | Abernathy Joshua Keith | $176,281 |
Source: Public Records
Tax History Compared to Growth
Tax History
| Year | Tax Paid | Tax Assessment Tax Assessment Total Assessment is a certain percentage of the fair market value that is determined by local assessors to be the total taxable value of land and additions on the property. | Land | Improvement |
|---|---|---|---|---|
| 2024 | $3,208 | $136,392 | $9,515 | $126,877 |
| 2023 | $2,995 | $127,332 | $8,892 | $118,440 |
| 2022 | $2,927 | $118,230 | $7,412 | $110,818 |
| 2021 | $2,538 | $99,157 | $7,412 | $91,745 |
| 2020 | $2,539 | $96,248 | $7,102 | $89,146 |
| 2019 | $2,562 | $96,248 | $7,102 | $89,146 |
| 2018 | $2,424 | $85,450 | $7,102 | $78,348 |
| 2017 | $2,338 | $80,820 | $7,102 | $73,718 |
| 2016 | $2,123 | $71,004 | $7,102 | $63,902 |
| 2015 | $1,889 | $71,004 | $7,102 | $63,902 |
| 2014 | $1,889 | $71,662 | $7,102 | $64,560 |
| 2013 | -- | $72,321 | $7,102 | $65,219 |
Source: Public Records
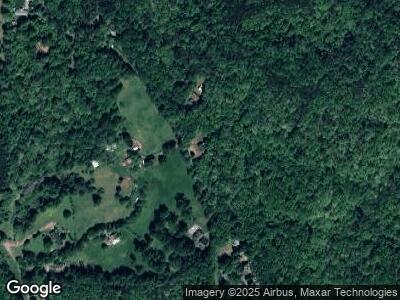
Map
Nearby Homes
- 117 Wesley Lee Rd
- 179 Caroline Ct
- 1786 Camp Wahsega Rd
- 117 Wahsega Way
- 532 Ridley Rd
- 0 Etowah River Estates Unit 7533869
- Tr 3 Glenn Elliot Rd
- 239 Glenn Elliott Rd
- 188 Hidden Cove Rd
- 46 Deer Acres Dr
- 357 Camp Wahsega Rd
- 0 Coopers Gap Rd Unit 10477248
- 338 Orchard Hill Rd
- 52 Cane Creek Valley Rd
- 0 Yahoola Ridge Unit 10489867
- 0 Yahoola Ridge Unit 7547908
- 34 Logsplitter Pass
- 478 Fred Ash Rd
- 502 Fred Ash Rd
- 385 Fred Ash Rd
- 409 Fred Ash Rd
- 336 Fred Ash Rd
- 324 Fred Ash Rd
- 307 Fred Ash Rd
- 318 Fred Ash Rd
- 620 Fred Ash Rd
- 300 Fred Ash Rd
- 1652 Duffy Grizzle Rd
- 673 Fred Ash Rd
- 1620 Duffy Grizzle Rd
- 213 Fred Ash Rd
- 745 Fred Ash Rd
- 0 Fred Ash Rd
- 177 Fred Ash Rd
- 1712 Duffy Grizzle Rd
- 1710 Duffy Grizzle Rd
- 1485 Duffy Grizzle Rd