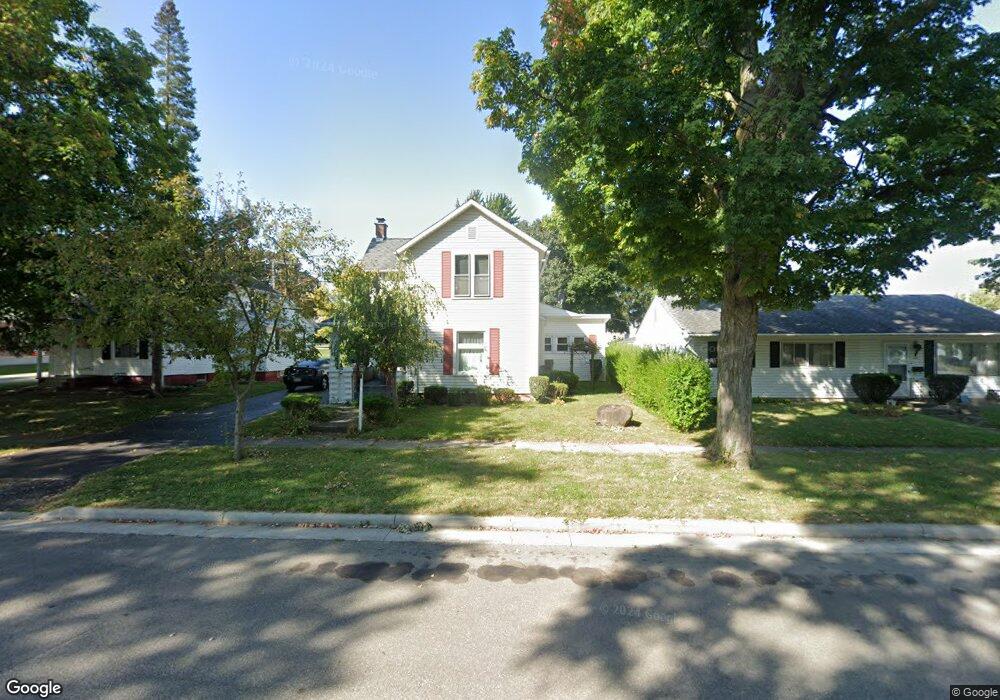
478 N 7th St Upper Sandusky, OH 43351
Estimated Value: $146,000 - $161,000
3
Beds
1
Bath
1,560
Sq Ft
$98/Sq Ft
Est. Value
About This Home
This home is located at 478 N 7th St, Upper Sandusky, OH 43351 and is currently estimated at $153,356, approximately $98 per square foot. 478 N 7th St is a home located in Wyandot County with nearby schools including Upper Sandusky High School and St. Peter Elementary School.
Ownership History
Date
Name
Owned For
Owner Type
Purchase Details
Closed on
Apr 20, 2016
Current Estimated Value
Home Financials for this Owner
Home Financials are based on the most recent Mortgage that was taken out on this home.
Interest Rate
3.58%
Purchase Details
Closed on
Sep 10, 2015
Sold by
Rowe Lucas M and Rowe Megan R
Bought by
Rowe Megan R
Home Financials for this Owner
Home Financials are based on the most recent Mortgage that was taken out on this home.
Original Mortgage
$74,897
Interest Rate
3.97%
Purchase Details
Closed on
May 28, 2015
Sold by
Taylor Jerry L and Taylor Donna J
Bought by
Rowe Lucas M and Rhoades Megan R
Home Financials for this Owner
Home Financials are based on the most recent Mortgage that was taken out on this home.
Original Mortgage
$74,897
Interest Rate
3.64%
Purchase Details
Closed on
Oct 29, 2012
Sold by
Gillen Frederick W and Gillen Connie J
Bought by
Taylor Jerry L and Taylor Donna J
Create a Home Valuation Report for This Property
The Home Valuation Report is an in-depth analysis detailing your home's value as well as a comparison with similar homes in the area
Home Values in the Area
Average Home Value in this Area
Purchase History
| Date | Buyer | Sale Price | Title Company |
|---|---|---|---|
| -- | -- | -- | |
| Rowe Megan R | -- | None Available | |
| Rowe Lucas M | $73,400 | None Available | |
| Taylor Jerry L | $71,000 | None Available |
Source: Public Records
Mortgage History
| Date | Status | Borrower | Loan Amount |
|---|---|---|---|
| Closed | -- | -- | |
| Previous Owner | Rowe Megan R | $74,897 | |
| Previous Owner | Rowe Lucas M | $74,897 | |
| Previous Owner | Rowe Lucas M | $1,835 |
Source: Public Records
Tax History
| Year | Tax Paid | Tax Assessment Tax Assessment Total Assessment is a certain percentage of the fair market value that is determined by local assessors to be the total taxable value of land and additions on the property. | Land | Improvement |
|---|---|---|---|---|
| 2025 | $1,502 | $49,910 | $4,840 | $45,070 |
| 2024 | $1,225 | $38,480 | $3,780 | $34,700 |
| 2023 | $1,225 | $38,480 | $3,780 | $34,700 |
| 2022 | $1,225 | $33,890 | $3,440 | $30,450 |
| 2021 | $1,129 | $33,890 | $3,440 | $30,450 |
| 2020 | $1,129 | $33,890 | $3,440 | $30,450 |
| 2019 | $1,127 | $33,890 | $3,440 | $30,450 |
| 2018 | $796 | $24,380 | $2,880 | $21,500 |
| 2017 | $809 | $24,380 | $2,880 | $21,500 |
| 2016 | -- | $24,380 | $2,880 | $21,500 |
| 2015 | -- | $26,620 | $2,880 | $23,740 |
| 2014 | -- | $26,620 | $2,880 | $23,740 |
| 2013 | -- | $26,620 | $2,880 | $23,740 |
Source: Public Records
Map
Nearby Homes
- 445 N Sandusky Ave
- 479 N 5th St
- 333 N 5th St
- 334 N 4th St
- 314 N 4th St
- 386 W Finley St
- 116 E Walker St
- 137 N 8th St
- 432 E Bigelow St
- 479 Front St
- 225 S Hazel St
- 326 S 8th St
- 430 S Sandusky Ave
- 105 Old Lincoln Hwy
- 387 S Warpole St
- 123 Rivers Edge Ln
- 9768 County Highway 111
- 101 Rivers Edge Ln
- 379 W Spring St
- 212 Duck Pond Rd
Your Personal Tour Guide
Ask me questions while you tour the home.