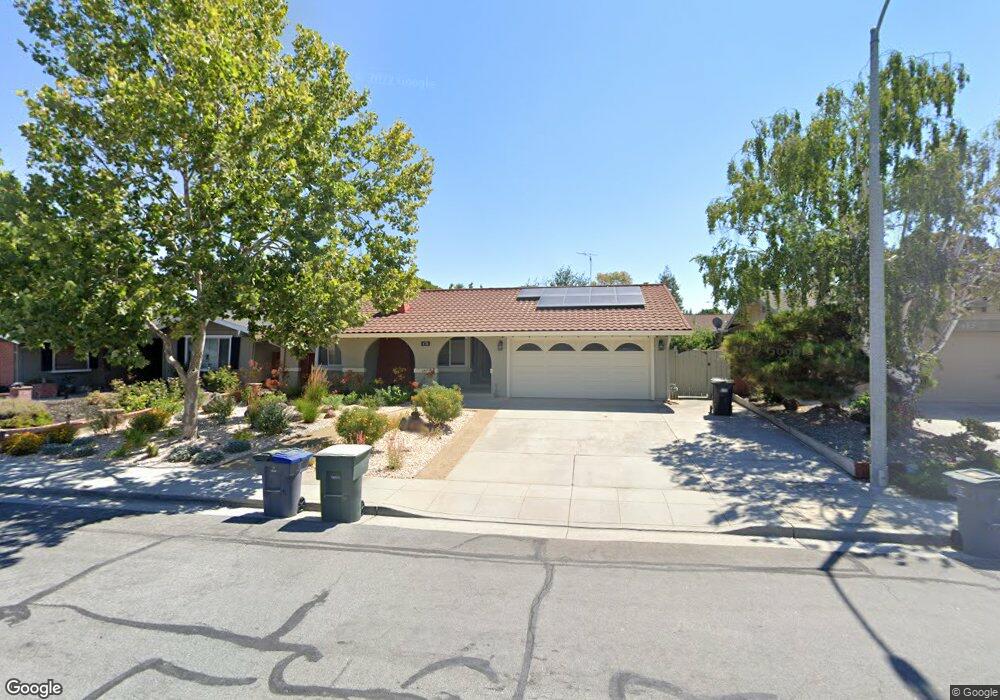
478 Sequoia Dr Sunnyvale, CA 94086
Ponderosa Park NeighborhoodEstimated Value: $2,158,000 - $2,483,000
3
Beds
2
Baths
1,407
Sq Ft
$1,629/Sq Ft
Est. Value
About This Home
This home is located at 478 Sequoia Dr, Sunnyvale, CA 94086 and is currently estimated at $2,291,830, approximately $1,628 per square foot. 478 Sequoia Dr is a home located in Santa Clara County with nearby schools including Braly Elementary School, Marian A. Peterson Middle School, and Adrian Wilcox High School.
Ownership History
Date
Name
Owned For
Owner Type
Purchase Details
Closed on
Dec 10, 2015
Sold by
Fung Jimmy Tsz Yin and Fung Rita Pei Shan Lee
Bought by
Fung Family Living Trust and Fung Rita Pei Shan Lee
Current Estimated Value
Purchase Details
Closed on
Dec 18, 2009
Sold by
Callahan Michelle P
Bought by
Fung Jimmy T and Fung Rita P
Home Financials for this Owner
Home Financials are based on the most recent Mortgage that was taken out on this home.
Original Mortgage
$563,960
Outstanding Balance
$367,469
Interest Rate
4.88%
Mortgage Type
New Conventional
Estimated Equity
$1,924,361
Purchase Details
Closed on
May 25, 2007
Sold by
Callahan Michelle P
Bought by
Callahan Michelle P
Purchase Details
Closed on
Jul 26, 1996
Sold by
Callahan F H and Callahan Joda Kay
Bought by
Callahan Francis H and Callahan Joda Kay
Create a Home Valuation Report for This Property
The Home Valuation Report is an in-depth analysis detailing your home's value as well as a comparison with similar homes in the area
Home Values in the Area
Average Home Value in this Area
Purchase History
| Date | Buyer | Sale Price | Title Company |
|---|---|---|---|
| Fung Family Living Trust | -- | None Available | |
| Fung Jimmy T | $705,000 | Chicago Title Company | |
| Callahan Michelle P | -- | None Available | |
| Callahan Francis H | -- | -- |
Source: Public Records
Mortgage History
| Date | Status | Borrower | Loan Amount |
|---|---|---|---|
| Open | Fung Jimmy T | $563,960 |
Source: Public Records
Tax History
| Year | Tax Paid | Tax Assessment Tax Assessment Total Assessment is a certain percentage of the fair market value that is determined by local assessors to be the total taxable value of land and additions on the property. | Land | Improvement |
|---|---|---|---|---|
| 2025 | $10,414 | $909,693 | $682,194 | $227,499 |
| 2024 | $10,414 | $891,857 | $668,818 | $223,039 |
| 2023 | $10,332 | $874,370 | $655,704 | $218,666 |
| 2022 | $10,192 | $857,227 | $642,848 | $214,379 |
| 2021 | $10,159 | $840,420 | $630,244 | $210,176 |
| 2020 | $9,974 | $831,803 | $623,782 | $208,021 |
| 2019 | $9,959 | $815,494 | $611,551 | $203,943 |
| 2018 | $9,321 | $799,505 | $599,560 | $199,945 |
| 2017 | $9,265 | $783,829 | $587,804 | $196,025 |
| 2016 | $9,088 | $768,461 | $576,279 | $192,182 |
| 2015 | $9,052 | $756,919 | $567,623 | $189,296 |
| 2014 | $8,621 | $742,093 | $556,505 | $185,588 |
Source: Public Records
Map
Nearby Homes
- 1006 E Evelyn Ave
- 999 W Evelyn Terrace Unit 75
- 999 W Evelyn Terrace Unit 40
- 999 W Evelyn Terrace Unit 54
- 212 Red Oak Dr E Unit A
- 1052 Aster Ave
- 792 Ponderosa Ave
- 1098 Barberry Terrace
- 201 Stone Pine Terrace Unit 2
- 247 Peppermint Tree Terrace Unit 5
- 1102 Althea Terrace Unit 2
- 1102 Althea Terrace Unit 6
- 1102 Althea Terrace Unit 1
- 1102 Althea Terrace Unit 4
- 1091 Reed Ave Unit D
- 338 Amaryllis Terrace
- 308 Torrey Pine Terrace Unit 613
- 308 Torrey Pine Terrace Unit 713
- 308 Torrey Pine Terrace Unit 720
- 1200 Althea Terrace Unit 301
Your Personal Tour Guide
Ask me questions while you tour the home.