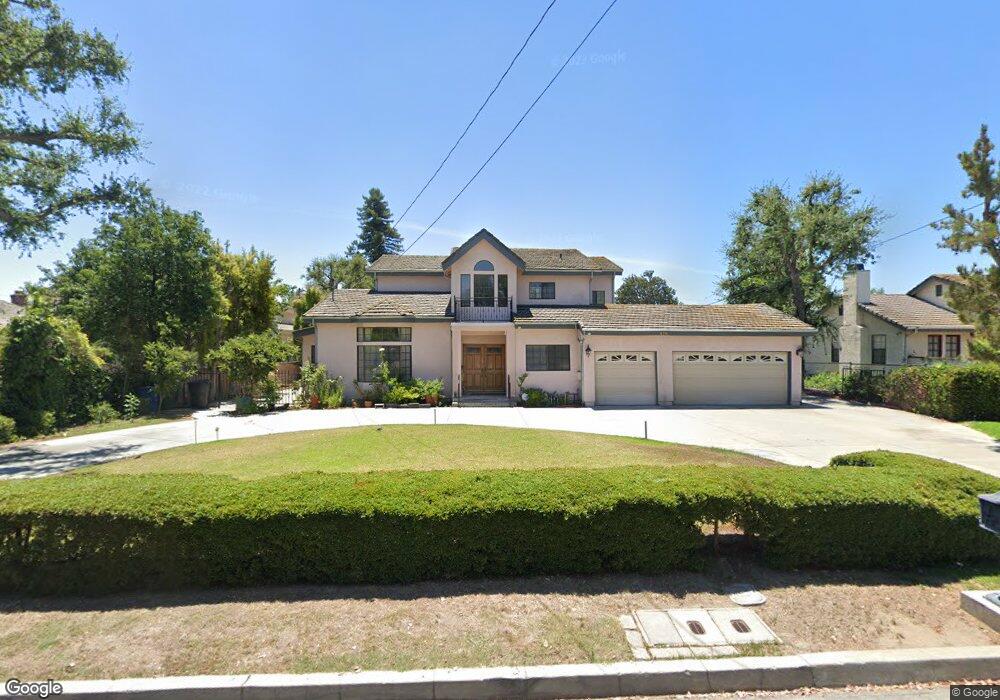
478 W Norman Ave Arcadia, CA 91007
Estimated Value: $2,050,000 - $3,650,000
6
Beds
5
Baths
3,979
Sq Ft
$674/Sq Ft
Est. Value
About This Home
This home is located at 478 W Norman Ave, Arcadia, CA 91007 and is currently estimated at $2,680,205, approximately $673 per square foot. 478 W Norman Ave is a home located in Los Angeles County with nearby schools including Baldwin Stocker Elementary School, First Avenue Middle School, and Arcadia High School.
Ownership History
Date
Name
Owned For
Owner Type
Purchase Details
Closed on
Oct 9, 2020
Sold by
Cheung Kwang Lit and Revoca Betty
Bought by
Kwang Lit Cheung And Betty Cheung Revocable T and Cheung
Current Estimated Value
Purchase Details
Closed on
May 2, 2017
Sold by
Cheung Kwang Lit and Cheung Betty
Bought by
Cheung Kwang Lit and Cheung Betty
Purchase Details
Closed on
Apr 24, 2017
Sold by
Kosnar Kenneth
Bought by
Cheung Norma Quan
Purchase Details
Closed on
Apr 18, 2017
Sold by
Cheung Norma Quan and Cheung Norma Q
Bought by
Lit Kwang and Cheung Betty
Purchase Details
Closed on
Jul 30, 2010
Sold by
Cheung Norma Quan and Cheung Norma Q
Bought by
Cheung Norma Quan and Kosnar Family Trust
Purchase Details
Closed on
Jun 18, 2010
Sold by
Cheung Kwang Lit and Cheung Betty
Bought by
Cheung Norma Q
Purchase Details
Closed on
Nov 14, 1995
Sold by
Cheung Kwang Lit and Cheung Betty
Bought by
Cheung Kwang Lit and Cheung Betty
Create a Home Valuation Report for This Property
The Home Valuation Report is an in-depth analysis detailing your home's value as well as a comparison with similar homes in the area
Home Values in the Area
Average Home Value in this Area
Purchase History
| Date | Buyer | Sale Price | Title Company |
|---|---|---|---|
| Kwang Lit Cheung And Betty Cheung Revocable T | -- | None Listed On Document | |
| Cheung Kwang Lit | -- | None Available | |
| Cheung Norma Quan | -- | None Available | |
| Lit Kwang | -- | None Available | |
| Cheung Norma Quan | -- | None Available | |
| Cheung Norma Quan | -- | None Available | |
| Cheung Norma Q | -- | None Available | |
| Cheung Kwang Lit | -- | None Available | |
| Cheung Kwang Lit | -- | -- |
Source: Public Records
Tax History Compared to Growth
Tax History
| Year | Tax Paid | Tax Assessment Tax Assessment Total Assessment is a certain percentage of the fair market value that is determined by local assessors to be the total taxable value of land and additions on the property. | Land | Improvement |
|---|---|---|---|---|
| 2025 | $7,922 | $671,033 | $160,093 | $510,940 |
| 2024 | $7,922 | $657,876 | $156,954 | $500,922 |
| 2023 | $7,761 | $644,977 | $153,877 | $491,100 |
| 2022 | $7,510 | $632,331 | $150,860 | $481,471 |
| 2021 | $7,353 | $619,933 | $147,902 | $472,031 |
| 2020 | $7,261 | $613,577 | $146,386 | $467,191 |
| 2019 | $7,178 | $601,547 | $143,516 | $458,031 |
| 2018 | $6,841 | $589,752 | $140,702 | $449,050 |
| 2016 | $6,672 | $566,854 | $135,240 | $431,614 |
| 2015 | $6,555 | $558,340 | $133,209 | $425,131 |
| 2014 | $6,479 | $547,404 | $130,600 | $416,804 |
Source: Public Records
Map
Nearby Homes
- 1430 Lovell Ave
- 2015 Bella Vista Ave
- 1419 Holly Ave
- 631 W Camino Real Ave
- 1522 S Baldwin Ave Unit 15
- 639 W Longden Ave
- 515 W Le Roy Ave
- 9861 E Lemon Ave
- 454 W Duarte Rd
- 330 W Le Roy Ave
- 239 W Norman Ave
- 471 W Duarte Rd Unit 216
- 400 Rosemarie Dr
- 445 W Duarte Rd Unit 5
- 2236 Holly Ave
- 6326 Golden Ave W
- 202 W Lemon Ave
- 212 W Las Flores Ave
- 540 Fairview Ave Unit 34
- 618 Fairview Ave Unit 109
- 468 W Norman Ave
- 504 W Norman Ave
- 466 W Norman Ave
- 501 Sharon Rd
- 479 Sharon Rd
- 510 W Norman Ave
- 507 Sharon Rd
- 464 W Norman Ave
- 473 Sharon Rd
- 514 W Norman Ave
- 513 Sharon Rd
- 501 W Norman Ave
- 479 W Norman Ave
- 467 Sharon Rd
- 473 W Norman Ave
- 509 W Norman Ave
- 469 W Norman Ave
- 522 W Norman Ave
- 450 W Norman Ave
- 519 Sharon Rd