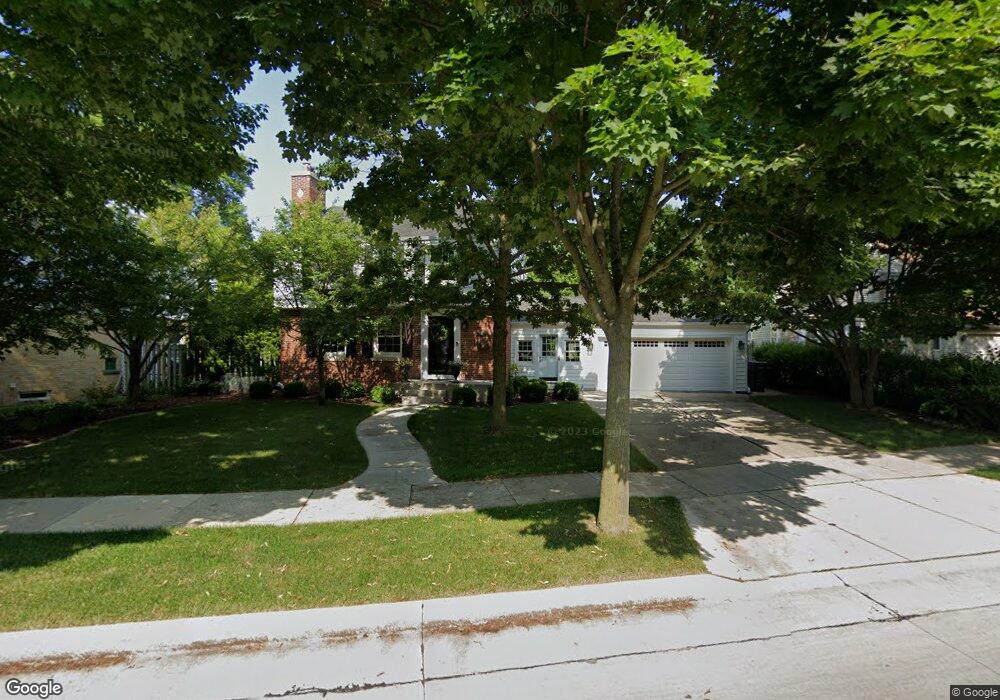
4780 N Bartlett Dr Milwaukee, WI 53211
Estimated Value: $549,000 - $764,000
3
Beds
2
Baths
1,665
Sq Ft
$370/Sq Ft
Est. Value
About This Home
This home is located at 4780 N Bartlett Dr, Milwaukee, WI 53211 and is currently estimated at $615,479, approximately $369 per square foot. 4780 N Bartlett Dr is a home located in Milwaukee County with nearby schools including Cumberland Elementary School, Whitefish Bay Middle School, and Whitefish Bay High School.
Ownership History
Date
Name
Owned For
Owner Type
Purchase Details
Closed on
Mar 14, 2006
Sold by
Garbo Brenda K and Kowalski Brenda
Bought by
Garbo Anthony R and Garbo Brenda K
Current Estimated Value
Purchase Details
Closed on
Oct 29, 2002
Sold by
Rice David J and Rice Jennifer K
Bought by
Kowalski Brenda
Home Financials for this Owner
Home Financials are based on the most recent Mortgage that was taken out on this home.
Original Mortgage
$232,750
Outstanding Balance
$98,277
Interest Rate
6.13%
Mortgage Type
Purchase Money Mortgage
Estimated Equity
$517,202
Purchase Details
Closed on
Jun 25, 1998
Sold by
Johnson Jeffery D and Passage Monica M
Bought by
Rice David and Krier Jennifer
Home Financials for this Owner
Home Financials are based on the most recent Mortgage that was taken out on this home.
Original Mortgage
$151,200
Interest Rate
7.15%
Mortgage Type
Purchase Money Mortgage
Create a Home Valuation Report for This Property
The Home Valuation Report is an in-depth analysis detailing your home's value as well as a comparison with similar homes in the area
Home Values in the Area
Average Home Value in this Area
Purchase History
| Date | Buyer | Sale Price | Title Company |
|---|---|---|---|
| Garbo Anthony R | -- | None Available | |
| Kowalski Brenda | $245,000 | -- | |
| Rice David | $168,000 | -- |
Source: Public Records
Mortgage History
| Date | Status | Borrower | Loan Amount |
|---|---|---|---|
| Open | Kowalski Brenda | $232,750 | |
| Closed | Rice David | $151,200 |
Source: Public Records
Tax History
| Year | Tax Paid | Tax Assessment Tax Assessment Total Assessment is a certain percentage of the fair market value that is determined by local assessors to be the total taxable value of land and additions on the property. | Land | Improvement |
|---|---|---|---|---|
| 2024 | $3,647 | $548,500 | $181,700 | $366,800 |
| 2023 | $6,567 | $411,400 | $181,700 | $229,700 |
| 2022 | $6,567 | $355,400 | $125,700 | $229,700 |
| 2021 | $6,567 | $355,400 | $125,700 | $229,700 |
| 2020 | $6,863 | $355,400 | $125,700 | $229,700 |
| 2019 | $6,976 | $355,400 | $125,700 | $229,700 |
| 2018 | $8,006 | $317,300 | $115,300 | $202,000 |
| 2017 | $7,314 | $317,300 | $115,300 | $202,000 |
| 2016 | $7,268 | $317,300 | $115,300 | $202,000 |
| 2015 | $7,227 | $317,300 | $115,300 | $202,000 |
| 2014 | $7,122 | $317,300 | $115,300 | $202,000 |
| 2013 | $7,194 | $321,300 | $115,300 | $206,000 |
Source: Public Records
Map
Nearby Homes
- 4832 N Newhall St
- 4840 N Larkin St
- 4925 N Bartlett Ave
- 1554 E Glendale Ave Unit 56
- 4685 N Woodburn St
- 5050 N Lake Dr
- 4855 N Ardmore Ave
- 4665 N Ardmore Ave
- 4480 N Bartlett Ave Unit 82
- 2301 E Glendale Ave
- 4455 N Frederick Ave
- 1213 E Kensington Blvd Unit 15
- 4640 N Woodruff Ave
- 4848 N Elkhart Ave
- 4419 N Prospect Ave
- 621 E Hampton Rd
- 4332 N Sheffield Ave
- 1907 E Wood Place Unit 1909
- 1031 E Circle Dr
- 5122 N Diversey Blvd
- 4796 N Bartlett Dr
- 4766 N Bartlett Dr
- 4785 N Oakland Ave
- 1727 E Hampton Rd
- 4773 N Oakland Ave
- 4800 N Bartlett Ave Unit 4800
- 4800 N Bartlett Ave Unit 4802
- 1728 E Hampton Rd
- 4810 N Bartlett Ave
- 4811 N Oakland Ave
- 4777 N Bartlett Dr
- 4771 N Bartlett Dr
- 4783 N Bartlett Dr
- 1801 E Hampton Rd
- 4759 N Bartlett Dr
- 4765 N Bartlett Dr
- 4789 N Bartlett Dr
- 1800 E Hampton Rd
- 4753 N Bartlett Dr
- 4780 N Oakland Ave
Your Personal Tour Guide
Ask me questions while you tour the home.