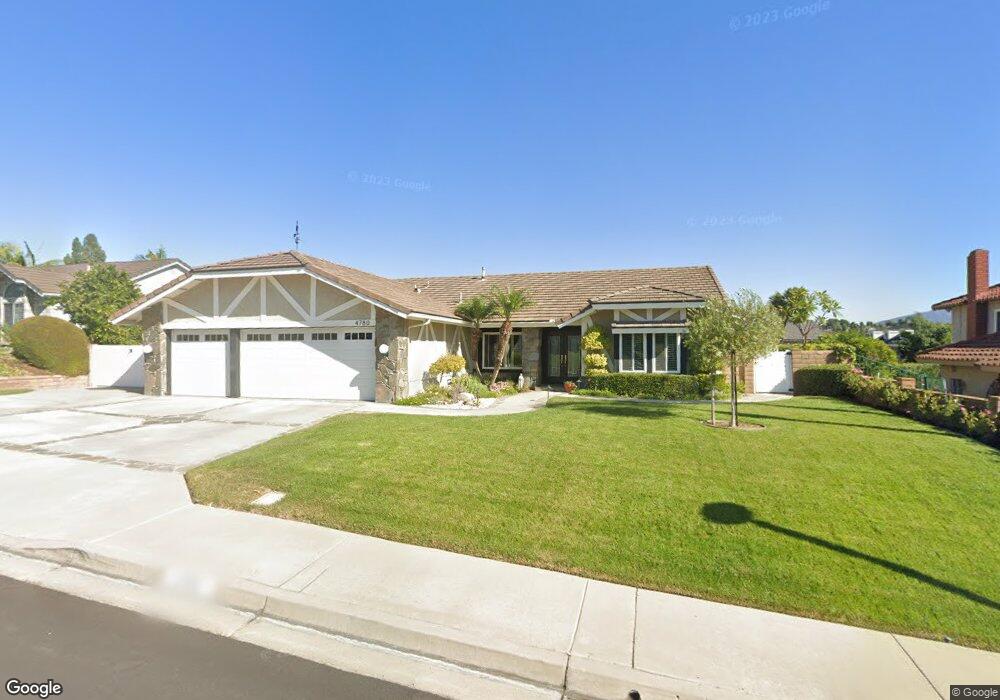
4780 Via Amante Yorba Linda, CA 92886
Estimated Value: $1,477,000 - $1,661,000
4
Beds
2
Baths
2,109
Sq Ft
$741/Sq Ft
Est. Value
About This Home
This home is located at 4780 Via Amante, Yorba Linda, CA 92886 and is currently estimated at $1,563,794, approximately $741 per square foot. 4780 Via Amante is a home located in Orange County with nearby schools including Travis Ranch Middle School, Yorba Linda High School, and Ivycrest Montessori Private School - Yorba Linda.
Ownership History
Date
Name
Owned For
Owner Type
Purchase Details
Closed on
Aug 7, 2020
Sold by
Hawley Stephen M and Hawley Jeannie
Bought by
Hawley Stephen M and Hawley Jeannie
Current Estimated Value
Purchase Details
Closed on
May 11, 1999
Sold by
Edward Latour and Edward Donna
Bought by
Hawley Stephen M and Hawley Jeannie
Home Financials for this Owner
Home Financials are based on the most recent Mortgage that was taken out on this home.
Original Mortgage
$278,000
Interest Rate
7.2%
Purchase Details
Closed on
Oct 14, 1998
Sold by
Edward Latour and Edward Donna
Bought by
Latour Edward J and Latour Donna J
Purchase Details
Closed on
Oct 25, 1993
Sold by
Bevill John M and Bevill Bonnie L
Bought by
Latour Edward J and Latour Donna J
Home Financials for this Owner
Home Financials are based on the most recent Mortgage that was taken out on this home.
Original Mortgage
$180,000
Interest Rate
3.25%
Create a Home Valuation Report for This Property
The Home Valuation Report is an in-depth analysis detailing your home's value as well as a comparison with similar homes in the area
Home Values in the Area
Average Home Value in this Area
Purchase History
| Date | Buyer | Sale Price | Title Company |
|---|---|---|---|
| Hawley Stephen M | -- | None Available | |
| Hawley Stephen M | $420,000 | North American Title Co | |
| Latour Edward J | -- | -- | |
| Latour Edward J | $280,000 | Orange Coast Title Company |
Source: Public Records
Mortgage History
| Date | Status | Borrower | Loan Amount |
|---|---|---|---|
| Previous Owner | Hawley Stephen M | $278,000 | |
| Previous Owner | Latour Edward J | $180,000 |
Source: Public Records
Tax History Compared to Growth
Tax History
| Year | Tax Paid | Tax Assessment Tax Assessment Total Assessment is a certain percentage of the fair market value that is determined by local assessors to be the total taxable value of land and additions on the property. | Land | Improvement |
|---|---|---|---|---|
| 2025 | $7,949 | $668,961 | $441,202 | $227,759 |
| 2024 | $7,949 | $655,845 | $432,551 | $223,294 |
| 2023 | $7,732 | $642,986 | $424,070 | $218,916 |
| 2022 | $7,671 | $630,379 | $415,755 | $214,624 |
| 2021 | $7,499 | $618,019 | $407,603 | $210,416 |
| 2020 | $7,355 | $611,682 | $403,423 | $208,259 |
| 2019 | $7,002 | $599,689 | $395,513 | $204,176 |
| 2018 | $6,923 | $587,931 | $387,758 | $200,173 |
| 2017 | $6,949 | $576,403 | $380,154 | $196,249 |
| 2016 | $6,657 | $565,101 | $372,700 | $192,401 |
| 2015 | $6,425 | $537,113 | $367,102 | $170,011 |
| 2014 | $6,266 | $526,592 | $359,911 | $166,681 |
Source: Public Records
Map
Nearby Homes
- 20681 Via Amarilla
- 20660 Calle Feliz
- 20640 Smoketree Ave
- 21590 Via Pepita
- 4465 San Antonio Rd
- 20709 Calle Pera
- 4811 Rideline Rd
- 21417 Zaca Ct
- 21451 Cloud Ridge
- 4152 Beech Ave
- 21620 Brisbane Way
- 5317 Via Ramon Rd
- 21290 Clear Haven Dr
- 4418 Avenida Del Este
- 4710 Avenida Del Este
- 21630 Dunrobin Way
- 4090 Naples Ct
- 4080 Naples Ct
- 4832 Via Frondosa
- 4362 Via Alegre
- 4760 Via Amante
- 4800 Via Amante
- 4785 Via Corzo
- 4755 Via Corzo
- 4755 Via Amante
- 4740 Via Amante
- 4735 Via Amante
- 4735 Via Corzo
- 4795 Via Corzo
- 4715 Via Amante
- 20955 Via Contento
- 4720 Via Amante
- 4715 Via Corzo
- 20751 Vista Del Sol
- 20741 Vista Del Sol
- 4825 Via Contento
- 4810 Via Contento
- 20750 Vista Del Sol
- 4695 Via Amante
- 20740 Via Amarilla