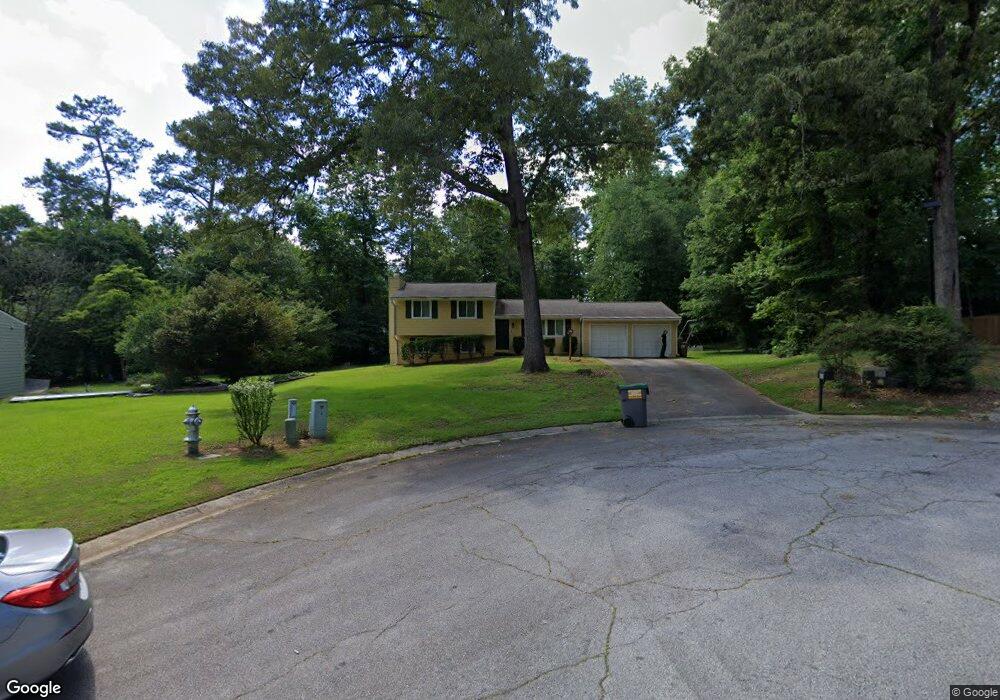
4781 N Inlet Dr Marietta, GA 30066
Sandy Plains NeighborhoodEstimated Value: $341,000 - $402,035
3
Beds
2
Baths
1,220
Sq Ft
$307/Sq Ft
Est. Value
About This Home
This home is located at 4781 N Inlet Dr, Marietta, GA 30066 and is currently estimated at $375,009, approximately $307 per square foot. 4781 N Inlet Dr is a home located in Cobb County with nearby schools including Keheley Elementary School and McCleskey Middle School.
Ownership History
Date
Name
Owned For
Owner Type
Purchase Details
Closed on
Sep 3, 2013
Sold by
Hennequant Justin B
Bought by
Hennequant Justin B and Hennequant Jennifer Lee
Current Estimated Value
Purchase Details
Closed on
Aug 16, 2007
Sold by
Sovereign Bk
Bought by
Hennequant Justin B
Home Financials for this Owner
Home Financials are based on the most recent Mortgage that was taken out on this home.
Original Mortgage
$153,820
Interest Rate
6.49%
Mortgage Type
FHA
Purchase Details
Closed on
Feb 6, 2007
Sold by
Washington Dannia
Bought by
Suntrust Mtg Inc
Purchase Details
Closed on
Dec 30, 2005
Sold by
Styles-Price Debra M
Bought by
Washington Dannia
Home Financials for this Owner
Home Financials are based on the most recent Mortgage that was taken out on this home.
Original Mortgage
$126,400
Interest Rate
6.18%
Mortgage Type
New Conventional
Create a Home Valuation Report for This Property
The Home Valuation Report is an in-depth analysis detailing your home's value as well as a comparison with similar homes in the area
Home Values in the Area
Average Home Value in this Area
Purchase History
| Date | Buyer | Sale Price | Title Company |
|---|---|---|---|
| Hennequant Justin B | -- | -- | |
| Hennequant Justin B | $156,300 | -- | |
| Suntrust Mtg Inc | $133,029 | -- | |
| Washington Dannia | $158,000 | -- |
Source: Public Records
Mortgage History
| Date | Status | Borrower | Loan Amount |
|---|---|---|---|
| Previous Owner | Hennequant Justin B | $153,820 | |
| Previous Owner | Washington Dannia | $126,400 |
Source: Public Records
Tax History Compared to Growth
Tax History
| Year | Tax Paid | Tax Assessment Tax Assessment Total Assessment is a certain percentage of the fair market value that is determined by local assessors to be the total taxable value of land and additions on the property. | Land | Improvement |
|---|---|---|---|---|
| 2025 | $3,129 | $132,076 | $36,000 | $96,076 |
| 2024 | $3,132 | $132,076 | $36,000 | $96,076 |
| 2023 | $2,683 | $136,384 | $36,000 | $100,384 |
| 2022 | $2,494 | $101,820 | $26,000 | $75,820 |
| 2021 | $2,089 | $83,308 | $24,000 | $59,308 |
| 2020 | $2,089 | $83,308 | $24,000 | $59,308 |
| 2019 | $2,108 | $84,204 | $18,400 | $65,804 |
| 2018 | $1,974 | $78,060 | $18,400 | $59,660 |
| 2017 | $1,740 | $71,208 | $18,400 | $52,808 |
| 2016 | $1,343 | $55,588 | $17,200 | $38,388 |
| 2015 | $1,237 | $50,820 | $12,000 | $38,820 |
| 2014 | $1,247 | $50,820 | $0 | $0 |
Source: Public Records
Map
Nearby Homes
- 4797 North Trail
- 4799 North Trail
- 4813 Highpoint Dr NE
- 4592 N Landing Dr
- 4709 Trickum Rd NE
- 2256 Turtle Club Dr NE Unit 1
- 4509 N Landing Dr
- 4924 Locklear Way
- 5009 Kingsley Manor Ct
- 4509 N Bay Ct
- 5100 Ravenwood Dr
- 2423 Turtle Crossing NE
- 1877 Falcon Wood Dr NE
- 4499 Browning Ct NE
- 205 Leland Way
- 1765 Blackwillow Dr
- 134 Sierra Cir
- 4784 N Inlet Dr
- 4779 N Inlet Dr Unit 2
- 4798 North Trail
- 4800 North Trail
- 4789 Tremont Ct NE
- 2070 N Landing Way
- 4790 Tremont Ct NE
- 4782 N Inlet Dr
- 2112 N Landing Way Unit 2
- 4800 Woodspring Dr NE Unit 198500
- 4800 Woodspring Dr NE
- 0 North Trail Unit 7415861
- 0 North Trail Unit 7367045
- 0 North Trail Unit 3231297
- 0 North Trail Unit 3208075
- 2089 N Landing Way Unit 2
- 2077 N Landing Way
- 2077 N Landing Way Unit 2077
- 4800 Tremont Ct NE
- 2101 N Landing Way Unit 2