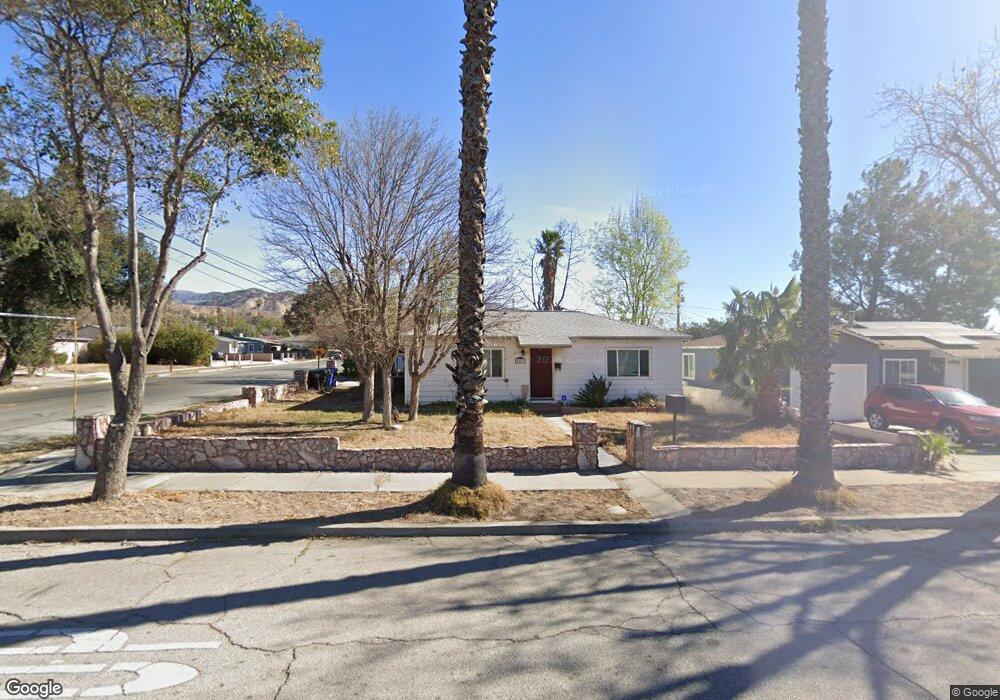
4783 N Mayfield Ave San Bernardino, CA 92407
Cajon NeighborhoodEstimated Value: $501,000 - $547,000
2
Beds
1
Bath
1,452
Sq Ft
$356/Sq Ft
Est. Value
About This Home
This home is located at 4783 N Mayfield Ave, San Bernardino, CA 92407 and is currently estimated at $516,725, approximately $355 per square foot. 4783 N Mayfield Ave is a home located in San Bernardino County with nearby schools including Hillside Elementary School, Shandin Hills Middle School, and Cajon High School.
Ownership History
Date
Name
Owned For
Owner Type
Purchase Details
Closed on
Oct 9, 2020
Sold by
Carlos Gustavo
Bought by
Mcdonald Logan Michael
Current Estimated Value
Home Financials for this Owner
Home Financials are based on the most recent Mortgage that was taken out on this home.
Original Mortgage
$368,207
Outstanding Balance
$327,500
Interest Rate
2.9%
Mortgage Type
FHA
Estimated Equity
$189,225
Purchase Details
Closed on
Jun 5, 2020
Sold by
Carlos Maria G
Bought by
Carlos Gustavo
Purchase Details
Closed on
Apr 10, 2018
Sold by
Shark Investments Llc
Bought by
Carlos Gustavo
Home Financials for this Owner
Home Financials are based on the most recent Mortgage that was taken out on this home.
Original Mortgage
$276,882
Interest Rate
4.4%
Mortgage Type
FHA
Purchase Details
Closed on
Jul 27, 2017
Sold by
Trevino Roberto C
Bought by
Shark Investments Llc
Purchase Details
Closed on
Jul 17, 2017
Sold by
Rudd Michael P and Lou Ann M Angeli Family Trust
Bought by
Trevino Roberto C
Purchase Details
Closed on
Feb 16, 1996
Sold by
Cannon Angeli Susan
Bought by
Angeli Mark Allan
Create a Home Valuation Report for This Property
The Home Valuation Report is an in-depth analysis detailing your home's value as well as a comparison with similar homes in the area
Home Values in the Area
Average Home Value in this Area
Purchase History
| Date | Buyer | Sale Price | Title Company |
|---|---|---|---|
| Mcdonald Logan Michael | $375,000 | Fidelity National Title Co | |
| Carlos Gustavo | -- | First American Title | |
| Carlos Gustavo | $282,000 | Old Republic Title Company | |
| Shark Investments Llc | -- | None Available | |
| Trevino Roberto C | -- | Lawyers Title | |
| Angeli Mark Allan | -- | -- |
Source: Public Records
Mortgage History
| Date | Status | Borrower | Loan Amount |
|---|---|---|---|
| Open | Mcdonald Logan Michael | $368,207 | |
| Previous Owner | Carlos Gustavo | $276,882 |
Source: Public Records
Tax History Compared to Growth
Tax History
| Year | Tax Paid | Tax Assessment Tax Assessment Total Assessment is a certain percentage of the fair market value that is determined by local assessors to be the total taxable value of land and additions on the property. | Land | Improvement |
|---|---|---|---|---|
| 2025 | $5,120 | $405,912 | $121,774 | $284,138 |
| 2024 | $5,120 | $397,953 | $119,386 | $278,567 |
| 2023 | $4,992 | $390,150 | $117,045 | $273,105 |
| 2022 | $5,003 | $382,500 | $114,750 | $267,750 |
| 2021 | $5,014 | $375,000 | $112,500 | $262,500 |
| 2020 | $6,354 | $293,383 | $88,015 | $205,368 |
| 2019 | $6,235 | $287,630 | $86,289 | $201,341 |
| 2018 | $3,297 | $240,000 | $72,000 | $168,000 |
| 2017 | $655 | $38,493 | $11,819 | $26,674 |
| 2016 | $636 | $37,738 | $11,587 | $26,151 |
| 2015 | $497 | $37,171 | $11,413 | $25,758 |
| 2014 | $483 | $36,442 | $11,189 | $25,253 |
Source: Public Records
Map
Nearby Homes
- 4956 N Stoddard Ave
- 4558 N Mountain View Ave
- 4966 N Stoddard Ave
- 4417 N Mayfield Ave
- 187 Carmelita Ln
- 4835 Acacia Ave
- 4776 Olivewood Ln
- 4655 Woodbend Ln
- 193 E 48th St
- 641 W 48th St
- 5304 Sierra Rd
- 564 Northpark Blvd
- 5406 N D St
- 4675 Sepulveda Ave
- 5095 N G St
- 3977 Acre Ln
- 5431 Monte Dr
- 661 W 55th St
- 0 W Hill Dr Unit IG25219633
- 287 E 48th St
- 4793 N Mayfield Ave
- 4767 N Mayfield Ave
- 4755 N Mayfield Ave
- 342 W 48th St
- 332 W 48th St
- 350 W 48th St
- 4731 N Mayfield Ave
- 324 W 48th St
- 4794 N Mayfield Ave
- 360 W 48th St
- 4794 Electric Ave
- 4768 N Mayfield Ave
- 4768 Electric Ave
- 4756 N Mayfield Ave
- 4756 Electric Ave
- 4717 N Mayfield Ave
- 314 W 48th St
- 368 W 48th St
- 4732 N Mayfield Ave
- 4732 Electric Ave