Estimated Value: $483,000 - $520,000
3
Beds
2
Baths
2,734
Sq Ft
$184/Sq Ft
Est. Value
About This Home
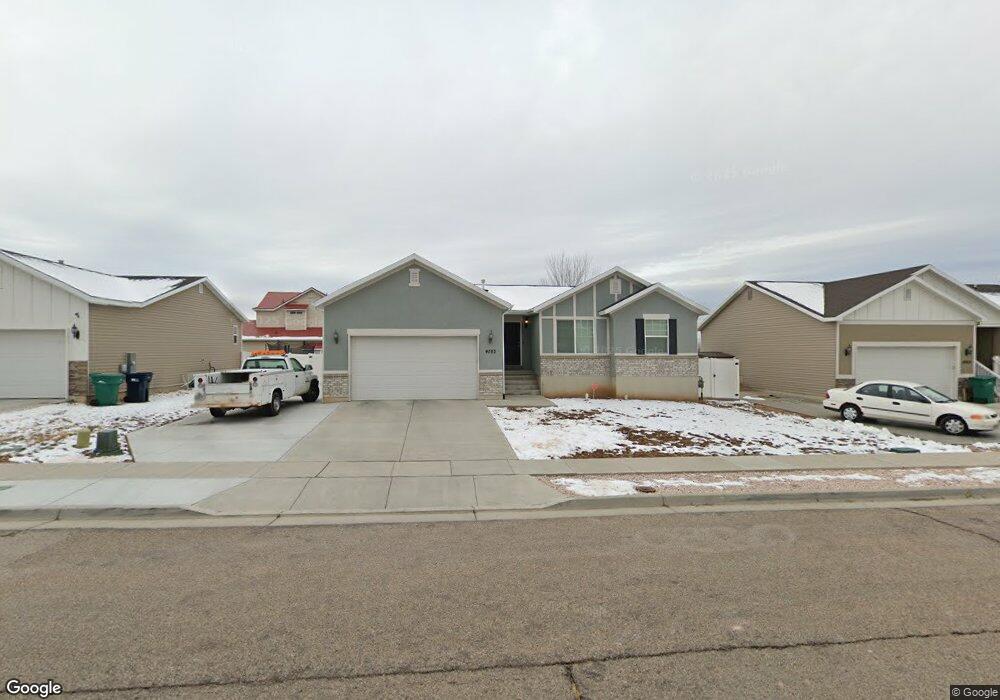
This home is located at 4783 S 2950 W, Roy, UT 84067 and is currently estimated at $503,020, approximately $183 per square foot. 4783 S 2950 W is a home located in Weber County with nearby schools including Midland School, Sand Ridge Junior High School, and Roy High School.
Ownership History
Date
Name
Owned For
Owner Type
Purchase Details
Closed on
Sep 1, 2016
Sold by
Haskell Homes Inc
Bought by
Cragun Steven L
Current Estimated Value
Home Financials for this Owner
Home Financials are based on the most recent Mortgage that was taken out on this home.
Original Mortgage
$13,350
Outstanding Balance
$10,670
Interest Rate
3.45%
Mortgage Type
Stand Alone Second
Estimated Equity
$492,350
Purchase Details
Closed on
Aug 14, 2014
Sold by
Sli Commercial Real Estate Co
Bought by
Updwell Development Llc
Create a Home Valuation Report for This Property
The Home Valuation Report is an in-depth analysis detailing your home's value as well as a comparison with similar homes in the area
Home Values in the Area
Average Home Value in this Area
Purchase History
| Date | Buyer | Sale Price | Title Company |
|---|---|---|---|
| Cragun Steven L | -- | Aspen Title | |
| Updwell Development Llc | -- | Bonneville Superior Title Co |
Source: Public Records
Mortgage History
| Date | Status | Borrower | Loan Amount |
|---|---|---|---|
| Open | Cragun Steven L | $13,350 |
Source: Public Records
Tax History Compared to Growth
Tax History
| Year | Tax Paid | Tax Assessment Tax Assessment Total Assessment is a certain percentage of the fair market value that is determined by local assessors to be the total taxable value of land and additions on the property. | Land | Improvement |
|---|---|---|---|---|
| 2025 | $3,007 | $483,626 | $140,018 | $343,608 |
| 2024 | $2,938 | $261,799 | $77,425 | $184,374 |
| 2023 | $2,605 | $230,450 | $71,507 | $158,943 |
| 2022 | $2,826 | $259,050 | $60,683 | $198,367 |
| 2021 | $2,337 | $352,000 | $85,376 | $266,624 |
| 2020 | $2,251 | $312,000 | $85,376 | $226,624 |
| 2019 | $2,183 | $285,000 | $59,616 | $225,384 |
| 2018 | $2,062 | $253,000 | $52,724 | $200,276 |
| 2017 | $2,145 | $249,000 | $52,724 | $196,276 |
| 2016 | $1,112 | $63,476 | $63,476 | $0 |
| 2015 | $610 | $43,190 | $43,190 | $0 |
| 2014 | -- | $0 | $0 | $0 |
Source: Public Records
Map
Nearby Homes
- 3014 W 4750 S
- 3046 W 4850 S
- 4635 S 2950 W
- 4891 S 2875 W
- 4918 S 2925 W
- 5003 S 2825 W
- 5009 S 2925 W
- 4875 S 2675 W
- 4919 S 2675 W
- 5063 S 2825 W
- 5056 S 2800 W
- 5007 S 2675 W
- 5173 S 2825 W
- 3084 W 4375 S
- 2816 W 4400 S
- 4510 Stone Creek Rd Unit F
- 1952 W 5450 S
- 4440 Stone Creek Rd Unit 2E
- 4670 S 2525 W
- 2979 W 4275 S