479 Balboa Ct San Dimas, CA 91773
Estimated Value: $802,000 - $1,002,000
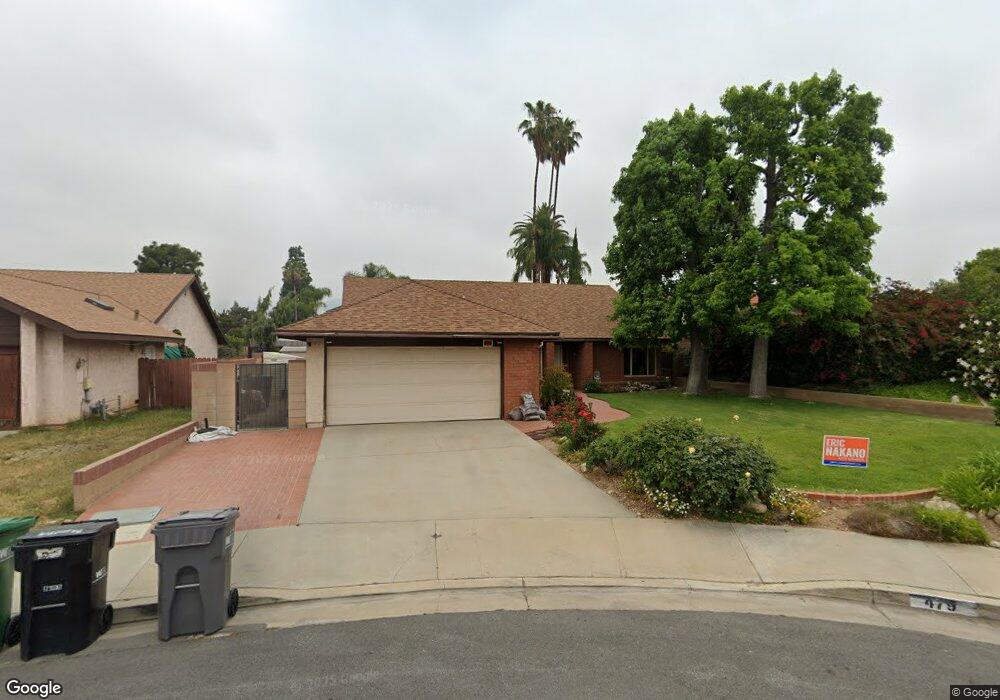
About This Home
This home is located at 479 Balboa Ct, San Dimas, CA 91773 and is currently estimated at $886,441, approximately $485 per square foot. 479 Balboa Ct is a home located in Los Angeles County with nearby schools including Fred Ekstrand Elementary School, Lone Hill Middle School, and San Dimas High School.
Ownership History
We collect this data history from publicly available records. To have your information removed, we recommend requesting removal directly through your county’s website.
Purchase Details
Purchase Details
Home Financials for this Owner
Home Financials are based on the most recent Mortgage that was taken out on this home.Home Values in the Area
Average Home Value in this Area
Purchase History
We collect this data history from publicly available records. To have your information removed, we recommend requesting removal directly through your county’s website.
| Date | Buyer | Sale Price | Title Company |
|---|---|---|---|
| -- | None Available | ||
| -- | None Available | ||
| -- | First American |
Mortgage History
We collect this data history from publicly available records. To have your information removed, we recommend requesting removal directly through your county’s website.
| Date | Status | Borrower | Loan Amount |
|---|---|---|---|
| Closed | $119,000 |
Tax History
We collect this data history from publicly available records. To have your information removed, we recommend requesting removal directly through your county’s website.
| Year | Tax Paid | Tax Assessment Tax Assessment Total Assessment is a certain percentage of the fair market value that is determined by local assessors to be the total taxable value of land and additions on the property. | Land | Improvement |
|---|---|---|---|---|
| 2025 | $2,952 | $188,680 | $42,153 | $146,527 |
| 2024 | $2,730 | $184,981 | $41,327 | $143,654 |
| 2023 | $2,671 | $181,355 | $40,517 | $140,838 |
| 2022 | $2,624 | $177,800 | $39,723 | $138,077 |
| 2021 | $2,563 | $174,315 | $38,945 | $135,370 |
| 2019 | $2,513 | $169,146 | $37,791 | $131,355 |
| 2018 | $2,319 | $165,830 | $37,050 | $128,780 |
| 2016 | $2,214 | $159,392 | $35,612 | $123,780 |
| 2015 | $2,182 | $156,999 | $35,078 | $121,921 |
| 2014 | $2,170 | $153,924 | $34,391 | $119,533 |
Map
- 502 E Bonita Ave
- 350 E Juanita Ave
- 317 Pony Express Rd
- 703 Via Los Santos
- 619 N Pershore Ave
- 612 N Maryport Ave
- 208 E 3rd St
- 2737 Pattiglen Ave
- 318 E Gladstone St
- 725 Palomares Ave
- 906 Majella Ave
- 736 N Walnut Ave
- 507 Juniper St
- 819 N Shaftesbury Ave
- 733 Lantana St
- 832 N Oceanbluff Ave
- 511 Damien Ave
- 402 E De Anza Heights Dr
- 152 Cedar Creek Rd
- 909 Lotus Cir
Ask me questions while you tour the home.