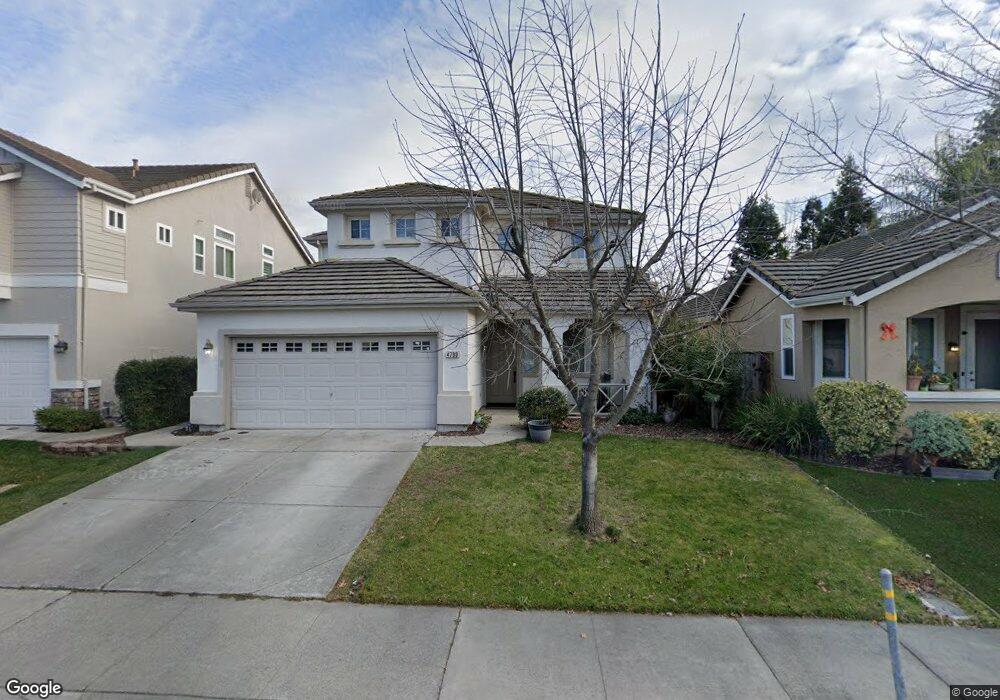
4790 Windsong St Sacramento, CA 95834
Sundance Lake NeighborhoodEstimated Value: $586,000 - $762,000
5
Beds
3
Baths
2,567
Sq Ft
$273/Sq Ft
Est. Value
About This Home
This home is located at 4790 Windsong St, Sacramento, CA 95834 and is currently estimated at $699,613, approximately $272 per square foot. 4790 Windsong St is a home located in Sacramento County with nearby schools including Paso Verde, Inderkum High School, and Natomas Pacific Pathways Prep.
Ownership History
Date
Name
Owned For
Owner Type
Purchase Details
Closed on
Dec 17, 2014
Sold by
Mai Qunzhu
Bought by
Ng Chester L
Current Estimated Value
Home Financials for this Owner
Home Financials are based on the most recent Mortgage that was taken out on this home.
Original Mortgage
$235,000
Outstanding Balance
$81,249
Interest Rate
3.96%
Mortgage Type
New Conventional
Estimated Equity
$618,364
Purchase Details
Closed on
May 5, 2005
Sold by
Roy Shon M
Bought by
Ng Chester L
Home Financials for this Owner
Home Financials are based on the most recent Mortgage that was taken out on this home.
Original Mortgage
$401,000
Interest Rate
4.8%
Mortgage Type
Negative Amortization
Purchase Details
Closed on
Jan 29, 2002
Sold by
Roy Andrea L
Bought by
Roy Shon M
Home Financials for this Owner
Home Financials are based on the most recent Mortgage that was taken out on this home.
Original Mortgage
$257,454
Interest Rate
7.15%
Create a Home Valuation Report for This Property
The Home Valuation Report is an in-depth analysis detailing your home's value as well as a comparison with similar homes in the area
Home Values in the Area
Average Home Value in this Area
Purchase History
| Date | Buyer | Sale Price | Title Company |
|---|---|---|---|
| Ng Chester L | -- | First American Title | |
| Ng Chester L | $548,500 | Fidelity National Title Co | |
| Roy Shon M | -- | First American Title Co | |
| Roy Shon M | $261,500 | First American Title Ins Co |
Source: Public Records
Mortgage History
| Date | Status | Borrower | Loan Amount |
|---|---|---|---|
| Open | Ng Chester L | $235,000 | |
| Closed | Ng Chester L | $401,000 | |
| Previous Owner | Roy Shon M | $257,454 |
Source: Public Records
Tax History Compared to Growth
Tax History
| Year | Tax Paid | Tax Assessment Tax Assessment Total Assessment is a certain percentage of the fair market value that is determined by local assessors to be the total taxable value of land and additions on the property. | Land | Improvement |
|---|---|---|---|---|
| 2025 | $8,851 | $719,931 | $327,558 | $392,373 |
| 2024 | $8,851 | $630,000 | $150,000 | $480,000 |
| 2023 | $8,434 | $621,000 | $150,000 | $471,000 |
| 2022 | $8,289 | $610,000 | $150,000 | $460,000 |
| 2021 | $8,411 | $603,400 | $258,521 | $344,879 |
| 2020 | $7,537 | $524,696 | $224,801 | $299,895 |
| 2019 | $7,427 | $504,516 | $216,155 | $288,361 |
| 2018 | $6,968 | $489,823 | $209,860 | $279,963 |
| 2017 | $6,677 | $470,985 | $201,789 | $269,196 |
| 2016 | $6,358 | $436,098 | $186,842 | $249,256 |
| 2015 | $6,225 | $415,332 | $177,945 | $237,387 |
| 2014 | $5,767 | $395,554 | $169,471 | $226,083 |
Source: Public Records
Map
Nearby Homes
- 4111 Windsong St
- 53 Goose Haven Ct
- 4 Windcatcher Ct
- 29 Windcatcher Ct
- 4876 Brookdale Dr Unit 161
- 4224 Floral Dr
- 4901 Gardendell Rd
- 4923 Gardendell Rd
- 4916 Brookdale Dr Unit 130
- 4001 Saintsbury Dr
- 4229 Bouquet Way
- 3878 Stemmler Dr
- 4216 Brookside Dr
- 4922 Brookdale Dr Unit 128
- 151 Jarvis Cir
- 133 Lily Bay Cir
- 169 Cafaro Cir
- 173 Julia Island Cir
- 3445 Hornsea Way
- 3235 Marrissey Ln
- 4796 Windsong St
- 4784 Windsong St
- 4802 Windsong St
- 4808 Windsong St
- 4791 Windsong St
- 4797 Windsong St
- 4785 Windsong St
- 4814 Windsong St
- 4803 Windsong St
- 4820 Windsong St
- 4779 Windsong St
- 4815 Windsong St
- 4826 Windsong St
- 4773 Windsong St
- 5 Goose Haven Ct
- 4832 Windsong St
- 4767 Windsong St
- 11 Goose Haven Ct
- 17 Goose Haven Ct
- 4761 Windsong St