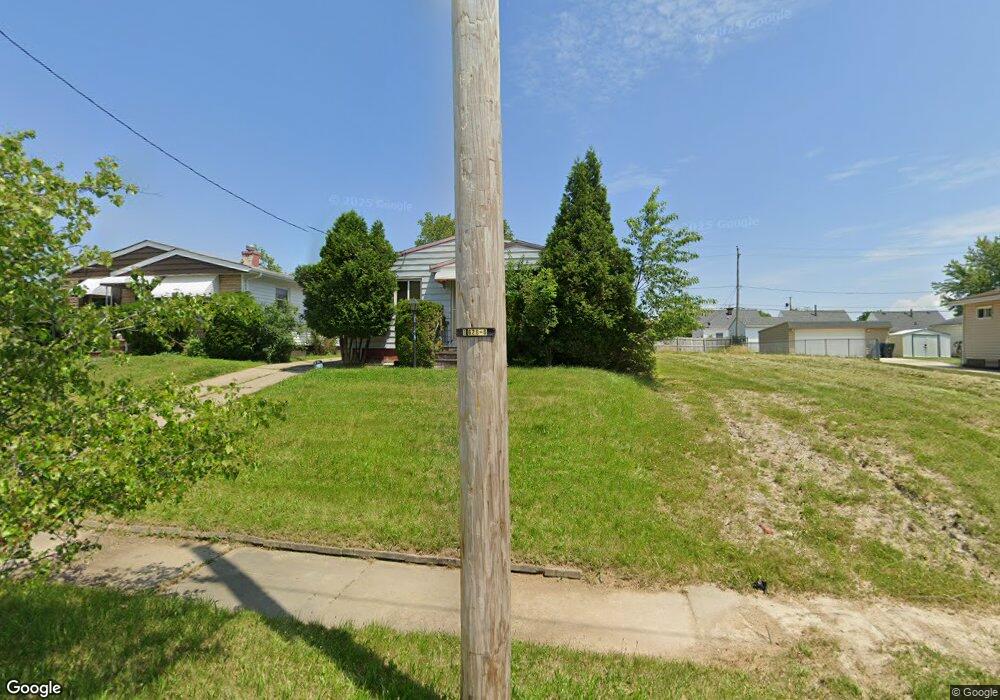
4791 E 176th St Cleveland, OH 44128
Lee-Miles NeighborhoodEstimated Value: $82,000 - $117,000
3
Beds
1
Bath
1,026
Sq Ft
$95/Sq Ft
Est. Value
About This Home
This home is located at 4791 E 176th St, Cleveland, OH 44128 and is currently estimated at $97,099, approximately $94 per square foot. 4791 E 176th St is a home located in Cuyahoga County with nearby schools including Citizens Academy Southeast, T2 Honors Academy, and Ramah Junior Academy.
Ownership History
Date
Name
Owned For
Owner Type
Purchase Details
Closed on
Nov 11, 2009
Sold by
Mccarver Leonard
Bought by
Johnson Channing
Current Estimated Value
Home Financials for this Owner
Home Financials are based on the most recent Mortgage that was taken out on this home.
Original Mortgage
$63,822
Outstanding Balance
$41,588
Interest Rate
4.96%
Mortgage Type
FHA
Estimated Equity
$55,511
Purchase Details
Closed on
Dec 5, 2007
Sold by
Smith Verdelle and Tolliver Frances E
Bought by
Federal Home Loan Mortgage Corporation
Purchase Details
Closed on
Nov 12, 2004
Sold by
Tolliver Orrin Lynn
Bought by
Smith Verdelle M
Purchase Details
Closed on
Oct 24, 2004
Sold by
Federal Home Loan Mortgage Corporation
Bought by
Mccarver Leonard
Purchase Details
Closed on
Jan 9, 2004
Sold by
Tolliver Frances E and Tolliver Orrin Lynn
Bought by
Tolliver Orrin Lynn
Purchase Details
Closed on
Aug 11, 1977
Sold by
Tolliver Orrin L and Tolliver Frances E
Bought by
Frances E Tolliver
Purchase Details
Closed on
Jan 1, 1975
Bought by
Tolliver Orrin L and Tolliver Frances E
Create a Home Valuation Report for This Property
The Home Valuation Report is an in-depth analysis detailing your home's value as well as a comparison with similar homes in the area
Home Values in the Area
Average Home Value in this Area
Purchase History
| Date | Buyer | Sale Price | Title Company |
|---|---|---|---|
| Johnson Channing | $65,000 | Attorney | |
| Federal Home Loan Mortgage Corporation | $33,334 | Attorney | |
| Smith Verdelle M | $63,000 | Public | |
| Mccarver Leonard | -- | Attorney | |
| Tolliver Orrin Lynn | -- | -- | |
| Frances E Tolliver | -- | -- | |
| Tolliver Orrin L | -- | -- |
Source: Public Records
Mortgage History
| Date | Status | Borrower | Loan Amount |
|---|---|---|---|
| Open | Johnson Channing | $63,822 |
Source: Public Records
Tax History
| Year | Tax Paid | Tax Assessment Tax Assessment Total Assessment is a certain percentage of the fair market value that is determined by local assessors to be the total taxable value of land and additions on the property. | Land | Improvement |
|---|---|---|---|---|
| 2024 | $1,400 | $21,350 | $5,425 | $15,925 |
| 2023 | $943 | $12,430 | $3,890 | $8,540 |
| 2022 | $937 | $12,430 | $3,890 | $8,540 |
| 2021 | $928 | $12,430 | $3,890 | $8,540 |
| 2020 | $985 | $11,410 | $3,570 | $7,840 |
| 2019 | $911 | $32,600 | $10,200 | $22,400 |
| 2018 | $998 | $11,410 | $3,570 | $7,840 |
| 2017 | $1,098 | $13,310 | $3,400 | $9,910 |
| 2016 | $1,089 | $13,310 | $3,400 | $9,910 |
| 2015 | $1,213 | $13,310 | $3,400 | $9,910 |
| 2014 | $1,213 | $14,770 | $3,780 | $10,990 |
Source: Public Records
Map
Nearby Homes
- 4744 E 176th St
- 4821 E 173rd St
- 4761 E 173rd St
- 17806 Tarkington Ave
- 5031 Cato St
- 17282 Mccracken Rd
- 16706 Myrtle Ave
- 16702 Tarkington Ave
- 16610 Priebe Ave
- 16817 Glenpark Ave
- 17208 Lipton Ave
- 5082 Philip Ave
- 5100 Erwin St
- 18704 Longview Ave
- 17001 Lipton Ave
- 16408 Highview Dr
- 5150 Arch St
- 18851 Raymond St
- 16307 Highview Dr
- 4549 Lee Rd
- 4787 E 176th St
- 4795 E 176th St
- 4799 E 176th St
- 4803 E 176th St
- 4792 E 177th St
- 4796 E 177th St
- 4807 E 176th St
- 4800 E 177th St
- 4804 E 177th St
- 4788 E 176th St
- 4792 E 176th St
- 4811 E 176th St
- 4808 E 177th St
- 4804 E 176th St
- 4780 E 176th St
- 4776 E 176th St
- 4815 E 176th St
- 4812 E 177th St
- 4808 E 176th St
- 4812 E 176th St
Your Personal Tour Guide
Ask me questions while you tour the home.