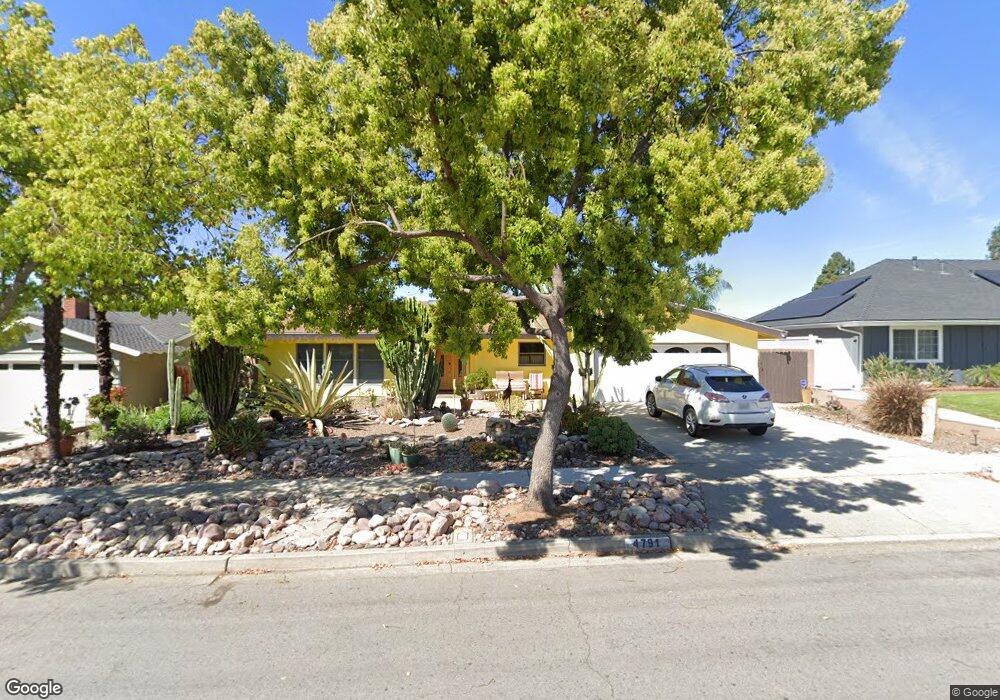
4791 Lesa Place Yorba Linda, CA 92886
Estimated Value: $1,215,000 - $1,549,000
4
Beds
2
Baths
2,485
Sq Ft
$536/Sq Ft
Est. Value
About This Home
This home is located at 4791 Lesa Place, Yorba Linda, CA 92886 and is currently estimated at $1,332,667, approximately $536 per square foot. 4791 Lesa Place is a home located in Orange County with nearby schools including Rose Drive Elementary, Yorba Linda Middle School, and El Dorado High School.
Ownership History
Date
Name
Owned For
Owner Type
Purchase Details
Closed on
Mar 10, 2003
Sold by
Stites Max D and Stites Mary D
Bought by
Stites Max Dale and Stites Mary Diane
Current Estimated Value
Purchase Details
Closed on
Mar 20, 2002
Sold by
Stites Max D
Bought by
Stites Max D and Stites Mary D
Home Financials for this Owner
Home Financials are based on the most recent Mortgage that was taken out on this home.
Original Mortgage
$234,000
Interest Rate
6.84%
Purchase Details
Closed on
Sep 28, 1994
Sold by
Robinson Charla A
Bought by
Stites Max D
Home Financials for this Owner
Home Financials are based on the most recent Mortgage that was taken out on this home.
Original Mortgage
$178,000
Interest Rate
3.87%
Create a Home Valuation Report for This Property
The Home Valuation Report is an in-depth analysis detailing your home's value as well as a comparison with similar homes in the area
Home Values in the Area
Average Home Value in this Area
Purchase History
| Date | Buyer | Sale Price | Title Company |
|---|---|---|---|
| Stites Max Dale | -- | -- | |
| Stites Max D | -- | -- | |
| Stites Max D | -- | Fidelity National Title | |
| Stites Max D | $222,500 | Orange Coast Title |
Source: Public Records
Mortgage History
| Date | Status | Borrower | Loan Amount |
|---|---|---|---|
| Closed | Stites Max D | $234,000 | |
| Closed | Stites Max D | $178,000 |
Source: Public Records
Tax History Compared to Growth
Tax History
| Year | Tax Paid | Tax Assessment Tax Assessment Total Assessment is a certain percentage of the fair market value that is determined by local assessors to be the total taxable value of land and additions on the property. | Land | Improvement |
|---|---|---|---|---|
| 2025 | $5,226 | $448,880 | $234,684 | $214,196 |
| 2024 | $5,226 | $440,079 | $230,082 | $209,997 |
| 2023 | $5,125 | $431,450 | $225,570 | $205,880 |
| 2022 | $5,065 | $422,991 | $221,147 | $201,844 |
| 2021 | $4,971 | $414,698 | $216,811 | $197,887 |
| 2020 | $4,867 | $410,446 | $214,588 | $195,858 |
| 2019 | $4,699 | $402,399 | $210,381 | $192,018 |
| 2018 | $4,639 | $394,509 | $206,256 | $188,253 |
| 2017 | $4,563 | $386,774 | $202,212 | $184,562 |
| 2016 | $4,471 | $379,191 | $198,247 | $180,944 |
| 2015 | $4,416 | $373,496 | $195,269 | $178,227 |
| 2014 | $4,285 | $366,180 | $191,444 | $174,736 |
Source: Public Records
Map
Nearby Homes
- 4802 Brookway Ave
- 4781 Kona Kove Way
- 1429 Prospect Ave Unit B
- 16692 Meadowview Dr
- 4654 Prospect Ln
- 4942 Gem Ln
- 11715 Rose Dr
- 17001 La Kenice Way
- 4571 Mimosa Dr
- 4882 Kermath St
- 1261 Desoto St
- 943 Berkenstock Ln
- 4215 Sand Rock Cir
- 5130 Webb Place
- 1701 Shaw Cir
- 619 E Yorba Linda Blvd
- 719 Cobb Ave
- 732 Olivier Dr
- 727 Olivier Dr
- 726 Olivier Dr
- 4801 Lesa Place
- 4771 Lesa Place
- 16842 Aries Dr
- 16831 Saga Dr
- 16851 Saga Dr
- 4792 Lesa Place
- 16841 Saga Dr
- 4792 Lavell Dr
- 4802 Lesa Place
- 4802 Lavell Dr
- 4772 Lavell Dr
- 16851 Aries Dr
- 16841 Aries Dr
- 4822 Lesa Place
- 4752 Lesa Place
- 4822 Lavell Dr
- 4801 Brookway Ave
- 16831 Aries Dr
- 16861 Aries Dr
- 4781 Brookway Ave