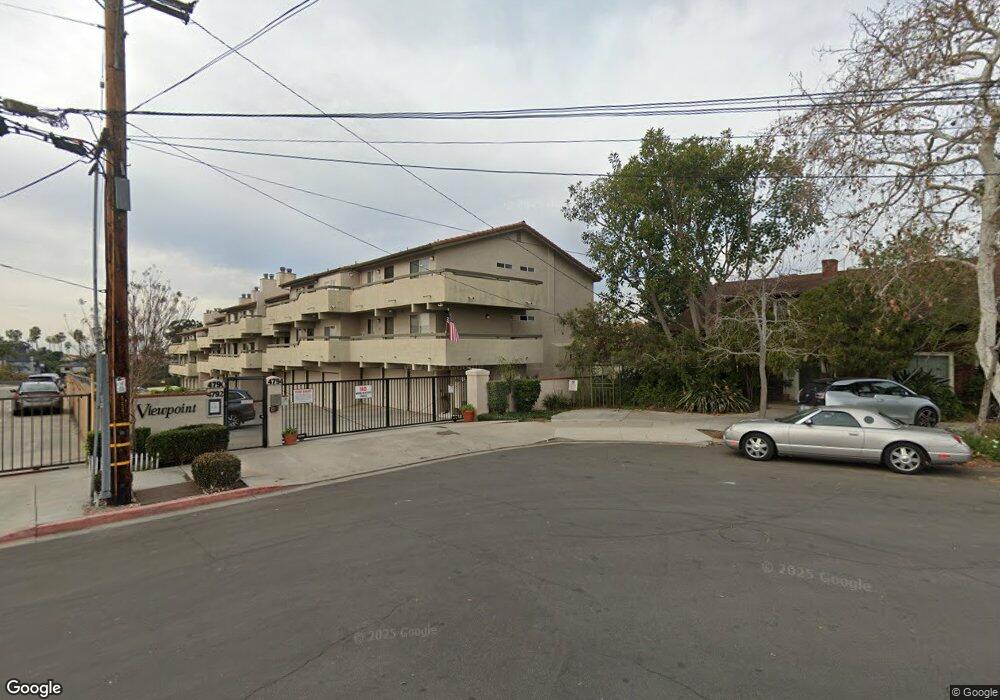
4794 Arizona St Unit 108 San Diego, CA 92116
North Park NeighborhoodEstimated Value: $653,117 - $675,000
2
Beds
2
Baths
980
Sq Ft
$677/Sq Ft
Est. Value
About This Home
This home is located at 4794 Arizona St Unit 108, San Diego, CA 92116 and is currently estimated at $663,779, approximately $677 per square foot. 4794 Arizona St Unit 108 is a home located in San Diego County with nearby schools including Garfield Elementary, Roosevelt International Middle School, and San Diego Global Vision Academy.
Ownership History
Date
Name
Owned For
Owner Type
Purchase Details
Closed on
Jul 24, 2003
Sold by
Acosta Rafael and Acosta Michelle J
Bought by
Mccormick Jerry and Pacheco Richard E
Current Estimated Value
Home Financials for this Owner
Home Financials are based on the most recent Mortgage that was taken out on this home.
Original Mortgage
$250,400
Outstanding Balance
$108,061
Interest Rate
5.46%
Mortgage Type
Purchase Money Mortgage
Estimated Equity
$555,718
Purchase Details
Closed on
Feb 14, 2000
Sold by
Mcgonagle Larry L and Mcgonagle Nanci K
Bought by
Acosta Rafael and Acosta Michelle J
Home Financials for this Owner
Home Financials are based on the most recent Mortgage that was taken out on this home.
Original Mortgage
$128,250
Interest Rate
8.26%
Mortgage Type
Purchase Money Mortgage
Purchase Details
Closed on
Dec 29, 1987
Create a Home Valuation Report for This Property
The Home Valuation Report is an in-depth analysis detailing your home's value as well as a comparison with similar homes in the area
Home Values in the Area
Average Home Value in this Area
Purchase History
| Date | Buyer | Sale Price | Title Company |
|---|---|---|---|
| Mccormick Jerry | $315,000 | First American Title Co | |
| Acosta Rafael | $135,000 | Fidelity National Title | |
| -- | $111,000 | -- |
Source: Public Records
Mortgage History
| Date | Status | Borrower | Loan Amount |
|---|---|---|---|
| Open | Mccormick Jerry | $250,400 | |
| Previous Owner | Acosta Rafael | $128,250 |
Source: Public Records
Tax History Compared to Growth
Tax History
| Year | Tax Paid | Tax Assessment Tax Assessment Total Assessment is a certain percentage of the fair market value that is determined by local assessors to be the total taxable value of land and additions on the property. | Land | Improvement |
|---|---|---|---|---|
| 2025 | $5,304 | $444,997 | $127,953 | $317,044 |
| 2024 | $5,304 | $436,273 | $125,445 | $310,828 |
| 2023 | $5,185 | $427,720 | $122,986 | $304,734 |
| 2022 | $5,046 | $419,334 | $120,575 | $298,759 |
| 2021 | $5,010 | $411,112 | $118,211 | $292,901 |
| 2020 | $4,948 | $406,897 | $116,999 | $289,898 |
| 2019 | $4,859 | $398,919 | $114,705 | $284,214 |
| 2018 | $4,542 | $391,098 | $112,456 | $278,642 |
| 2017 | $80 | $370,000 | $216,000 | $154,000 |
| 2016 | $3,762 | $325,000 | $190,000 | $135,000 |
| 2015 | $3,470 | $300,000 | $176,000 | $124,000 |
| 2014 | $2,894 | $250,000 | $147,000 | $103,000 |
Source: Public Records
Map
Nearby Homes
- 4714-16 Arizona St
- 2436 Adams Ave
- 4722 Oregon St
- 4838 Idaho St
- 4915 Uvada Place
- 4665 Oregon St Unit 6
- 4612 Hamilton St
- 2820 Adams Ave
- 4657 Idaho St
- 4545 Arizona St Unit 107
- 4545 Arizona St Unit 101
- 4621 Alabama St
- 4518 Arizona St
- 4971 Vista Place Unit B
- 2930 Copley Ave
- 4479 Louisiana St Unit 7
- 4425 Louisiana St Unit 2
- 4617 4621 Idaho St
- 4876 4878 34th St
- 4662 4664 Bancroft
- 4794 Arizona St Unit 206
- 4794 Arizona St Unit 101
- 4794 Arizona St Unit 209
- 4794 Arizona St Unit 208
- 4794 Arizona St Unit 207
- 4794 Arizona St Unit 205
- 4794 Arizona St Unit 204
- 4794 Arizona St Unit 203
- 4794 Arizona St Unit 202
- 4794 Arizona St Unit 201
- 4794 Arizona St Unit 109
- 4794 Arizona St Unit 107
- 4794 Arizona St Unit 106
- 4794 Arizona St Unit 105
- 4794 Arizona St Unit 104
- 4794 Arizona St Unit 103
- 4794 Arizona St Unit 102
- 4794 Arizona St Unit 308
- 4794 Arizona St Unit 307
- 4794 Arizona St Unit 306