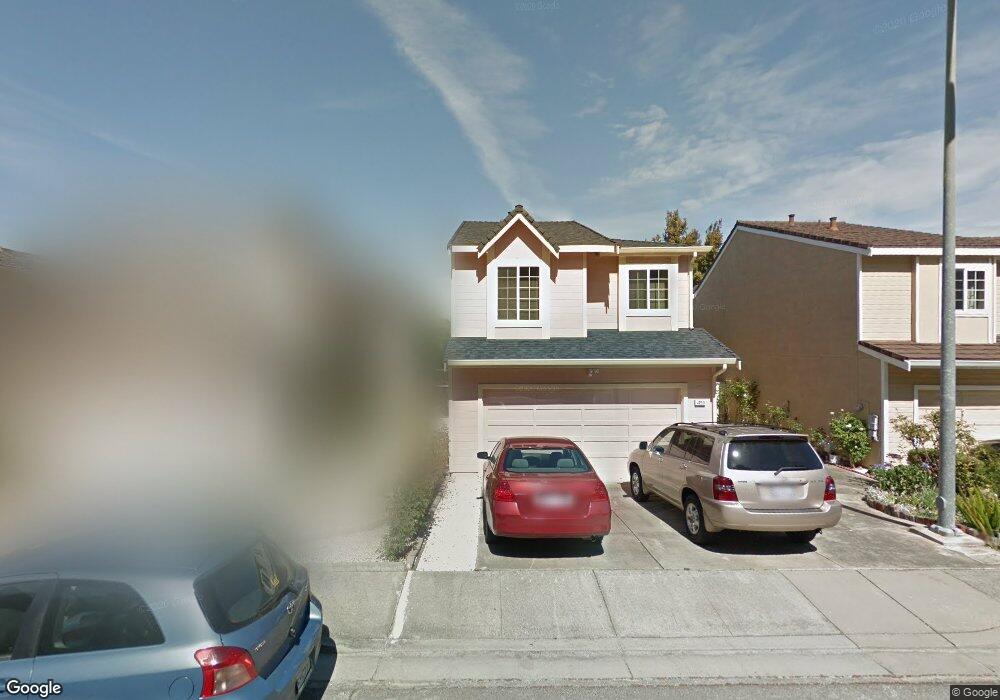
4794 Garnet Common Fremont, CA 94555
Ardenwood NeighborhoodEstimated Value: $1,434,140 - $1,509,000
3
Beds
3
Baths
1,477
Sq Ft
$999/Sq Ft
Est. Value
About This Home
This home is located at 4794 Garnet Common, Fremont, CA 94555 and is currently estimated at $1,475,285, approximately $998 per square foot. 4794 Garnet Common is a home located in Alameda County with nearby schools including Forest Park Elementary, Thornton Middle School, and American High School.
Ownership History
Date
Name
Owned For
Owner Type
Purchase Details
Closed on
Dec 19, 2018
Sold by
Kolar Prashanth and Karanam Sandhya
Bought by
Kolar Prashanth and Karanam Sandhya
Current Estimated Value
Purchase Details
Closed on
Sep 2, 2009
Sold by
Ganapathy Sivakumar S and Gopalakrishnan Gayathri
Bought by
Kolar Prashanth and Karanam Sandhya
Home Financials for this Owner
Home Financials are based on the most recent Mortgage that was taken out on this home.
Original Mortgage
$554,766
Outstanding Balance
$362,999
Interest Rate
5.2%
Mortgage Type
FHA
Estimated Equity
$1,112,286
Purchase Details
Closed on
Jul 21, 2008
Sold by
Ganapathy Sivakumar S and Gopalakrishnan Gayathri
Bought by
Ganapathy Sivakumar S and Gopalakrishnan Gayathri
Home Financials for this Owner
Home Financials are based on the most recent Mortgage that was taken out on this home.
Original Mortgage
$333,000
Interest Rate
5.5%
Mortgage Type
New Conventional
Purchase Details
Closed on
Sep 18, 2003
Sold by
Khatib Said A and Khatib Suha
Bought by
Ganapathy Sivakumar S and Gopalakrishnan Gayathri
Home Financials for this Owner
Home Financials are based on the most recent Mortgage that was taken out on this home.
Original Mortgage
$370,400
Interest Rate
5%
Mortgage Type
Purchase Money Mortgage
Create a Home Valuation Report for This Property
The Home Valuation Report is an in-depth analysis detailing your home's value as well as a comparison with similar homes in the area
Home Values in the Area
Average Home Value in this Area
Purchase History
| Date | Buyer | Sale Price | Title Company |
|---|---|---|---|
| Kolar Prashanth | -- | None Available | |
| Kolar Prashanth | $565,000 | Chicago Title Company | |
| Ganapathy Sivakumar S | -- | Fidelity National Title Co | |
| Ganapathy Sivakumar S | $463,000 | Chicago Title Company |
Source: Public Records
Mortgage History
| Date | Status | Borrower | Loan Amount |
|---|---|---|---|
| Open | Kolar Prashanth | $554,766 | |
| Previous Owner | Ganapathy Sivakumar S | $333,000 | |
| Previous Owner | Ganapathy Sivakumar S | $370,400 | |
| Closed | Ganapathy Sivakumar S | $46,300 |
Source: Public Records
Tax History Compared to Growth
Tax History
| Year | Tax Paid | Tax Assessment Tax Assessment Total Assessment is a certain percentage of the fair market value that is determined by local assessors to be the total taxable value of land and additions on the property. | Land | Improvement |
|---|---|---|---|---|
| 2025 | $8,841 | $722,261 | $218,778 | $510,483 |
| 2024 | $8,841 | $707,967 | $214,490 | $500,477 |
| 2023 | $8,600 | $700,950 | $210,285 | $490,665 |
| 2022 | $8,484 | $680,208 | $206,162 | $481,046 |
| 2021 | $8,276 | $666,738 | $202,121 | $471,617 |
| 2020 | $8,284 | $666,834 | $200,050 | $466,784 |
| 2019 | $8,189 | $653,761 | $196,128 | $457,633 |
| 2018 | $8,028 | $640,947 | $192,284 | $448,663 |
| 2017 | $7,827 | $628,381 | $188,514 | $439,867 |
| 2016 | $7,691 | $616,064 | $184,819 | $431,245 |
| 2015 | $7,586 | $606,814 | $182,044 | $424,770 |
| 2014 | $7,453 | $594,933 | $178,480 | $416,453 |
Source: Public Records
Map
Nearby Homes
- 34768 Swain Common
- 4834 Garnet Common
- 34627 Pueblo Terrace
- 34607 Pueblo Terrace
- 34565 Pueblo Terrace
- 34771 Tuxedo Common Unit 52
- 5004 Crandallwood Dr
- 34648 Musk Terrace
- 34579 Bluestone Common
- 35345 Cabral Dr
- 5176 Tacoma Common
- 35377 Cabrillo Dr
- 5220 Fairbanks Common
- 34512 Nantucket Common
- 34552 Nantucket Common
- 34539 Nantucket Common
- 4015 Clydesdale Common
- 34917 Sea Cliff Terrace
- 5308 Tacoma Common
- 35282 Cano Ct
- 4790 Garnet Common
- 4798 Garnet Common
- 4786 Garnet Common
- 4802 Garnet Common
- 4806 Garnet Common
- 4793 Ridgewood Dr
- 4797 Ridgewood Dr
- 4782 Garnet Common
- 4789 Ridgewood Dr
- 34780 Swain Common
- 4801 Ridgewood Dr
- 4810 Garnet Common
- 4785 Ridgewood Dr
- 4805 Ridgewood Dr
- 34776 Swain Common
- 34783 Swain Common
- 4781 Ridgewood Dr
- 4814 Garnet Common
- 4809 Ridgewood Dr
- 34773 Comstock Common