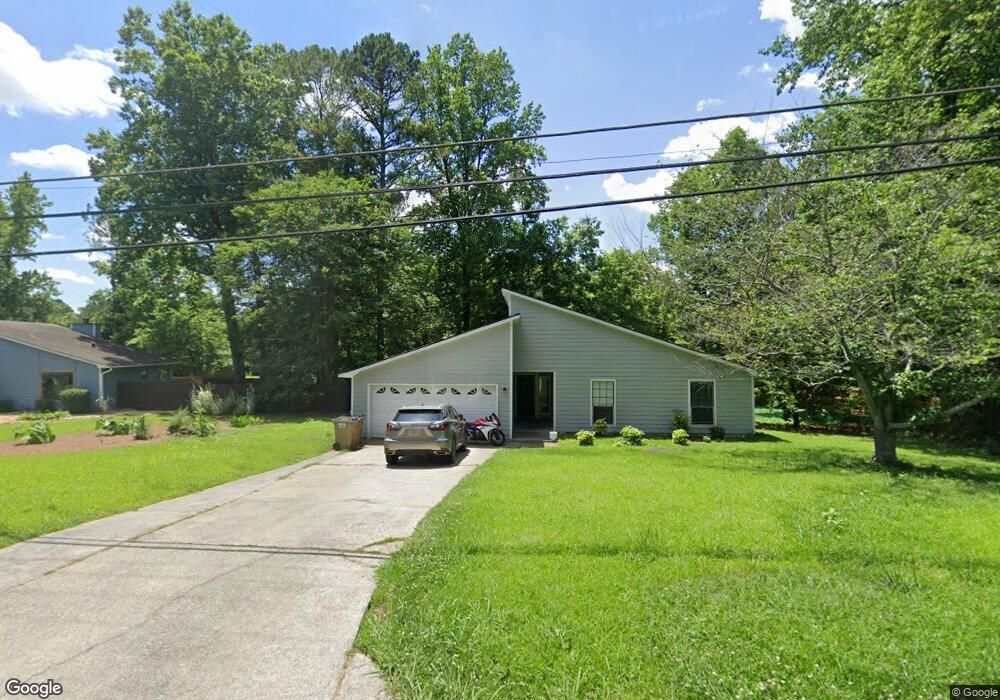
4795 Jamerson Forest Cir Unit 3 Marietta, GA 30066
Sandy Plains NeighborhoodEstimated Value: $359,489 - $399,000
3
Beds
2
Baths
1,636
Sq Ft
$231/Sq Ft
Est. Value
About This Home
This home is located at 4795 Jamerson Forest Cir Unit 3, Marietta, GA 30066 and is currently estimated at $377,622, approximately $230 per square foot. 4795 Jamerson Forest Cir Unit 3 is a home located in Cobb County with nearby schools including Keheley Elementary School, McCleskey Middle School, and The Garden School.
Ownership History
Date
Name
Owned For
Owner Type
Purchase Details
Closed on
May 23, 2022
Sold by
Griffin Phillip S
Bought by
Sfr Investments V Borrower I Llc
Current Estimated Value
Purchase Details
Closed on
Jan 25, 2002
Sold by
Brown Chad D
Bought by
Griffin Phillip S
Home Financials for this Owner
Home Financials are based on the most recent Mortgage that was taken out on this home.
Original Mortgage
$130,150
Interest Rate
6.95%
Mortgage Type
New Conventional
Purchase Details
Closed on
May 29, 1998
Sold by
Bryant Walter H and Bryant Sharon F
Bought by
Brown Chad D and Womack Wendy
Home Financials for this Owner
Home Financials are based on the most recent Mortgage that was taken out on this home.
Original Mortgage
$105,931
Interest Rate
7.11%
Mortgage Type
FHA
Purchase Details
Closed on
Aug 15, 1995
Sold by
Fitzgerald Kimberly H
Bought by
Bryant Walter H Sharon
Create a Home Valuation Report for This Property
The Home Valuation Report is an in-depth analysis detailing your home's value as well as a comparison with similar homes in the area
Home Values in the Area
Average Home Value in this Area
Purchase History
| Date | Buyer | Sale Price | Title Company |
|---|---|---|---|
| Sfr Investments V Borrower I Llc | $325,000 | None Listed On Document | |
| Griffin Phillip S | $137,000 | -- | |
| Brown Chad D | $106,000 | -- | |
| Bryant Walter H Sharon | $89,000 | -- |
Source: Public Records
Mortgage History
| Date | Status | Borrower | Loan Amount |
|---|---|---|---|
| Previous Owner | Griffin Phillip S | $130,150 | |
| Previous Owner | Brown Chad D | $105,931 | |
| Closed | Bryant Walter H Sharon | $0 |
Source: Public Records
Tax History Compared to Growth
Tax History
| Year | Tax Paid | Tax Assessment Tax Assessment Total Assessment is a certain percentage of the fair market value that is determined by local assessors to be the total taxable value of land and additions on the property. | Land | Improvement |
|---|---|---|---|---|
| 2025 | $4,231 | $140,440 | $36,000 | $104,440 |
| 2024 | $3,640 | $120,732 | $28,800 | $91,932 |
| 2023 | $3,640 | $120,732 | $28,800 | $91,932 |
| 2022 | $3,592 | $118,356 | $24,000 | $94,356 |
| 2021 | $2,964 | $97,676 | $22,000 | $75,676 |
| 2020 | $2,553 | $84,132 | $22,000 | $62,132 |
| 2019 | $2,148 | $70,784 | $18,000 | $52,784 |
| 2018 | $2,148 | $70,784 | $18,000 | $52,784 |
| 2017 | $1,681 | $58,460 | $18,000 | $40,460 |
| 2016 | $1,512 | $52,576 | $17,100 | $35,476 |
| 2015 | $1,549 | $52,576 | $17,100 | $35,476 |
| 2014 | $1,385 | $46,632 | $0 | $0 |
Source: Public Records
Map
Nearby Homes
- 4791 Jamerson Forest Cir
- 2899 Treeside Terrace
- 1513 Jamerson Landing
- 4680 Jamerson Forest Pkwy
- 4782 Jamerson Creek Ct
- 1528 Forest Trace
- 4758 Jamerson Forest Cir
- 4941 Willow Ln
- 1634 Barrier Rd
- 4924 Locklear Way
- 4865 Chapelle Ct
- 4422 Inlet Rd
- 4855 Rockford Ridge Dr
- 4413 Inlet Rd
- 1765 Blackwillow Dr
- 5009 Kingsley Manor Ct
- 4813 Highpoint Dr NE
- 4592 N Landing Dr
- 4795 Jamerson Forest Cir
- 4797 Jamerson Forest Cir Unit 3
- 4793 Jamerson Forest Cir Unit 3
- 4789 Rubes Creek Dr Unit 5
- 4700 Jamerson Forest Cir
- 4788 Rubes Creek Dr
- 1504 Rubes Landing
- 4799 Jamerson Forest Cir
- 4791 Rubes Creek Dr
- 4796 Jamerson Forest Cir Unit 3
- 1503 Rubes Landing Unit 3
- 4790 Rubes Creek Dr
- 4702 Jamerson Forest Cir
- 4790 Jamerson Forest Cir
- 1507 Rubes Landing
- 4703 Jamerson Forest Cir
- 4794 Rubes Creek Dr
- 1508 Rubes Landing Unit 4
- 4704 Jamerson Forest Cir Unit 2
- 4764 Jamerson Forest Pkwy