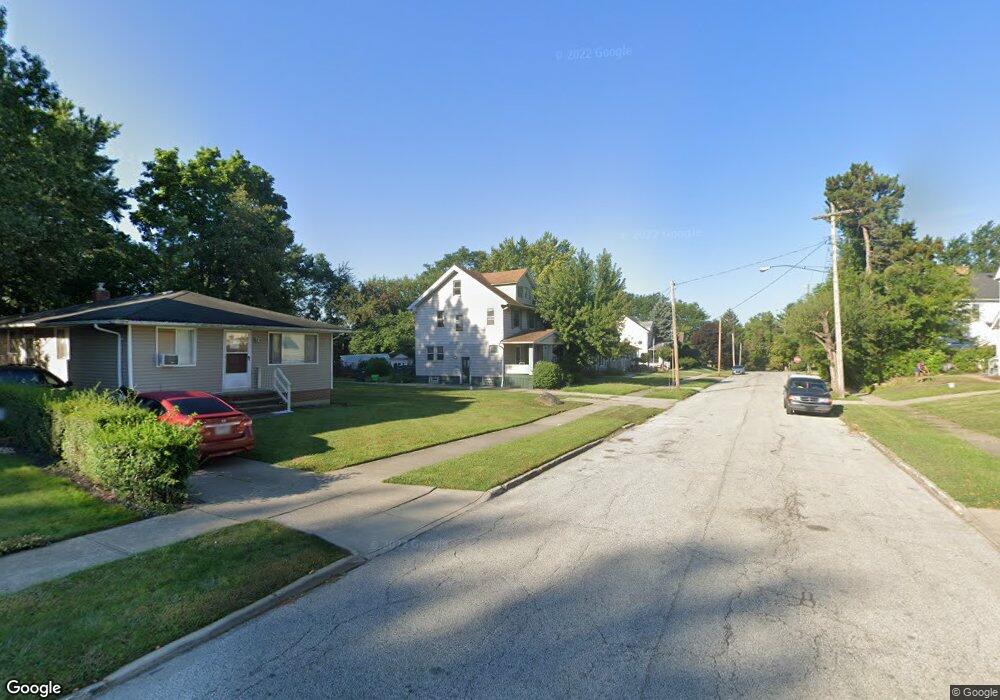
4797 Rockwood Rd Cleveland, OH 44125
Estimated Value: $98,001 - $107,000
3
Beds
1
Bath
1,248
Sq Ft
$83/Sq Ft
Est. Value
About This Home
This home is located at 4797 Rockwood Rd, Cleveland, OH 44125 and is currently estimated at $104,000, approximately $83 per square foot. 4797 Rockwood Rd is a home located in Cuyahoga County with nearby schools including Garfield Heights High School, North Shore High School, and Holy Name Elementary School.
Ownership History
Date
Name
Owned For
Owner Type
Purchase Details
Closed on
Oct 5, 2011
Sold by
U S Bank Na
Bought by
Brown Harolyn C
Current Estimated Value
Purchase Details
Closed on
May 3, 2011
Sold by
Brnich Monica A and Schaefer Monica A
Bought by
U S Bank Na
Purchase Details
Closed on
Feb 12, 1996
Sold by
Eizember David J
Bought by
Schaefer Monica A
Home Financials for this Owner
Home Financials are based on the most recent Mortgage that was taken out on this home.
Original Mortgage
$73,400
Interest Rate
7.11%
Mortgage Type
New Conventional
Purchase Details
Closed on
Apr 15, 1988
Sold by
Sliwinski Stanley W
Bought by
Eizember David J
Purchase Details
Closed on
Dec 7, 1983
Sold by
Sliwinski Stanley W and Sliwinski Eleanore
Bought by
Sliwinski Stanley W
Purchase Details
Closed on
Jan 1, 1975
Bought by
Sliwinski Stanley W and Sliwinski Eleanore
Create a Home Valuation Report for This Property
The Home Valuation Report is an in-depth analysis detailing your home's value as well as a comparison with similar homes in the area
Home Values in the Area
Average Home Value in this Area
Purchase History
| Date | Buyer | Sale Price | Title Company |
|---|---|---|---|
| Brown Harolyn C | $10,500 | Land Castle Title | |
| U S Bank Na | $22,000 | None Available | |
| Schaefer Monica A | $74,000 | -- | |
| Eizember David J | $42,000 | -- | |
| Sliwinski Stanley W | -- | -- | |
| Sliwinski Stanley W | -- | -- |
Source: Public Records
Mortgage History
| Date | Status | Borrower | Loan Amount |
|---|---|---|---|
| Previous Owner | Schaefer Monica A | $73,400 |
Source: Public Records
Tax History Compared to Growth
Tax History
| Year | Tax Paid | Tax Assessment Tax Assessment Total Assessment is a certain percentage of the fair market value that is determined by local assessors to be the total taxable value of land and additions on the property. | Land | Improvement |
|---|---|---|---|---|
| 2024 | $3,972 | $37,870 | $8,680 | $29,190 |
| 2023 | $2,828 | $24,610 | $5,920 | $18,690 |
| 2022 | $2,787 | $24,610 | $5,920 | $18,690 |
| 2021 | $2,945 | $24,610 | $5,920 | $18,690 |
| 2020 | $2,937 | $19,670 | $4,730 | $14,950 |
| 2019 | $2,512 | $56,200 | $13,500 | $42,700 |
| 2018 | $2,474 | $19,670 | $4,730 | $14,950 |
| 2017 | $2,451 | $17,960 | $3,750 | $14,210 |
| 2016 | $2,486 | $17,960 | $3,750 | $14,210 |
| 2015 | $5,287 | $17,960 | $3,750 | $14,210 |
| 2014 | $5,287 | $21,880 | $4,590 | $17,290 |
Source: Public Records
Map
Nearby Homes
- 4699 Burleigh Rd
- 8304 Garfield Blvd
- 4633 Warner Rd
- 4695 E 85th St
- 4840 E 84th St
- 0 Grand Division Ave
- 4821 E 85th St
- 8027 Grand Division Ave
- 4646 E 86th St
- 4815 E 86th St
- 4684 E 88th St
- 4888 E 85th St
- 8115 Bancroft Ave
- 8209 Bancroft Ave
- 4762 E 90th St
- 4665 E 88th St
- 4729 E 90th St
- 4769 E 90th St
- 4909 E 85th St
- 4915 E 88th St
- 4801 Rockwood Rd
- 4805 Rockwood Rd
- 4791 Rockwood Rd
- 4787 Rockwood Rd
- 4809 Rockwood Rd
- 4813 Rockwood Rd
- 4781 Rockwood Rd
- 4794 Rockwood Rd
- 4806 Rockwood Rd
- 4790 Rockwood Rd
- 4817 Rockwood Rd
- 4769 Burleigh Rd
- 4779 Rockwood Rd
- 4763 Burleigh Rd
- 4780 Rockwood Rd
- 4761 Burleigh Rd
- 4775 Rockwood Rd
- 4825 Rockwood Rd
- 4757 Burleigh Rd
- 4757 Burleigh Rd Unit RA