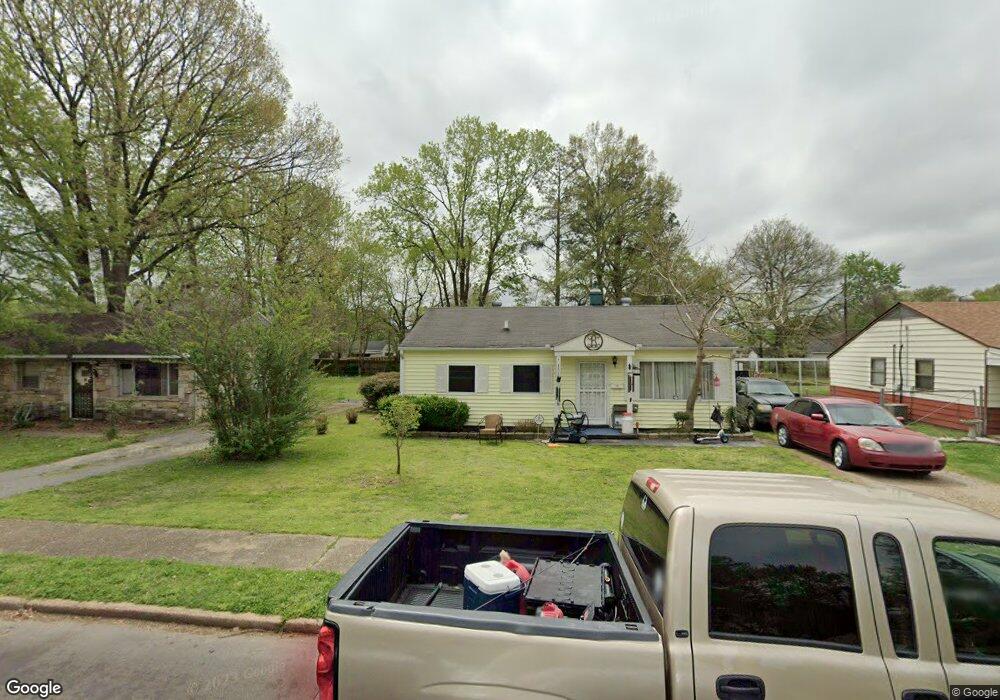
4799 Montgomery Rd Millington, TN 38053
Estimated Value: $118,160 - $139,000
3
Beds
1
Bath
875
Sq Ft
$149/Sq Ft
Est. Value
About This Home
This home is located at 4799 Montgomery Rd, Millington, TN 38053 and is currently estimated at $130,040, approximately $148 per square foot. 4799 Montgomery Rd is a home located in Shelby County with nearby schools including Millington Elementary School, Millington High School, and Lighthouse Christian Academy.
Ownership History
Date
Name
Owned For
Owner Type
Purchase Details
Closed on
Nov 30, 2015
Sold by
Patrick Christopher Hays and Patrick Jennifer D
Bought by
Hodges Daniel and Hodges Angela
Current Estimated Value
Purchase Details
Closed on
May 1, 2006
Sold by
Hodges Richard L and Hodges Rita
Bought by
Patrick Christopher Hays and Patrick Jennifer D
Purchase Details
Closed on
Jun 13, 2003
Sold by
Strevel Benny Douglas and Strevel Debra
Bought by
Hodges Richard
Purchase Details
Closed on
Mar 31, 2000
Sold by
Va
Bought by
Strevel Benny Douglas and Strevel Debra
Home Financials for this Owner
Home Financials are based on the most recent Mortgage that was taken out on this home.
Original Mortgage
$36,700
Interest Rate
7.75%
Mortgage Type
Seller Take Back
Purchase Details
Closed on
Aug 26, 1999
Sold by
Allen Steven E and Allen Lori A
Bought by
Va
Purchase Details
Closed on
May 28, 1998
Sold by
Allen Lori A
Bought by
Allen Steven Eugene
Create a Home Valuation Report for This Property
The Home Valuation Report is an in-depth analysis detailing your home's value as well as a comparison with similar homes in the area
Home Values in the Area
Average Home Value in this Area
Purchase History
| Date | Buyer | Sale Price | Title Company |
|---|---|---|---|
| Hodges Daniel | $470,000 | Brasfield & Associates Llc | |
| Patrick Christopher Hays | $216,000 | None Available | |
| Hodges Richard | $33,700 | -- | |
| Strevel Benny Douglas | $37,200 | -- | |
| Va | $32,349 | -- | |
| Allen Steven Eugene | -- | -- |
Source: Public Records
Mortgage History
| Date | Status | Borrower | Loan Amount |
|---|---|---|---|
| Previous Owner | Strevel Benny Douglas | $36,700 |
Source: Public Records
Tax History Compared to Growth
Tax History
| Year | Tax Paid | Tax Assessment Tax Assessment Total Assessment is a certain percentage of the fair market value that is determined by local assessors to be the total taxable value of land and additions on the property. | Land | Improvement |
|---|---|---|---|---|
| 2025 | $501 | $26,200 | $4,975 | $21,225 |
| 2024 | -- | $17,875 | $3,625 | $14,250 |
| 2023 | $856 | $17,875 | $3,625 | $14,250 |
| 2022 | $856 | $17,875 | $3,625 | $14,250 |
| 2021 | $867 | $17,875 | $3,625 | $14,250 |
| 2020 | $762 | $13,650 | $3,625 | $10,025 |
| 2019 | $553 | $13,650 | $3,625 | $10,025 |
| 2018 | $762 | $13,650 | $3,625 | $10,025 |
| 2017 | $770 | $13,650 | $3,625 | $10,025 |
| 2016 | $786 | $13,325 | $0 | $0 |
| 2014 | $582 | $13,325 | $0 | $0 |
Source: Public Records
Map
Nearby Homes
- 4721 Janie Ave
- 4741 Janie Ave
- 4812 Janie Ave
- 4734 Janie Ave
- 4752 Janie Cove
- 4655 Doris Cir S
- 4880 Easley Ave
- 5852 U S Highway 51
- 4853 2nd Ave
- 7727 Tecumseh St
- 4915 1st Ave
- 8852 U S 51
- 7988 Royster Creek Dr E
- 7288 U S Highway 51
- 0000 U S Highway 51
- 7963 Royster Creek Dr
- 7955 Royster Creek Dr
- 7943 Royster Creek Dr
- 7988 Royster Creek Dr
- 7932 Royster Creek Dr
- 4793 Montgomery Rd
- 4803 Montgomery Rd
- 4809 Montgomery Rd
- 4787 Montgomery Rd
- 4794 Saratoga Rd
- 4788 Saratoga Rd
- 4800 Saratoga Rd
- 4815 Montgomery Rd
- 4781 Montgomery Rd
- 4806 Saratoga Rd
- 4782 Saratoga Rd
- 4798 Montgomery Rd
- 4804 Montgomery Rd
- 4792 Montgomery Rd
- 4810 Montgomery Rd
- 4786 Montgomery Rd
- 4776 Saratoga Rd
- 4812 Saratoga Rd
- 4821 Montgomery Rd
- 4775 Montgomery Rd