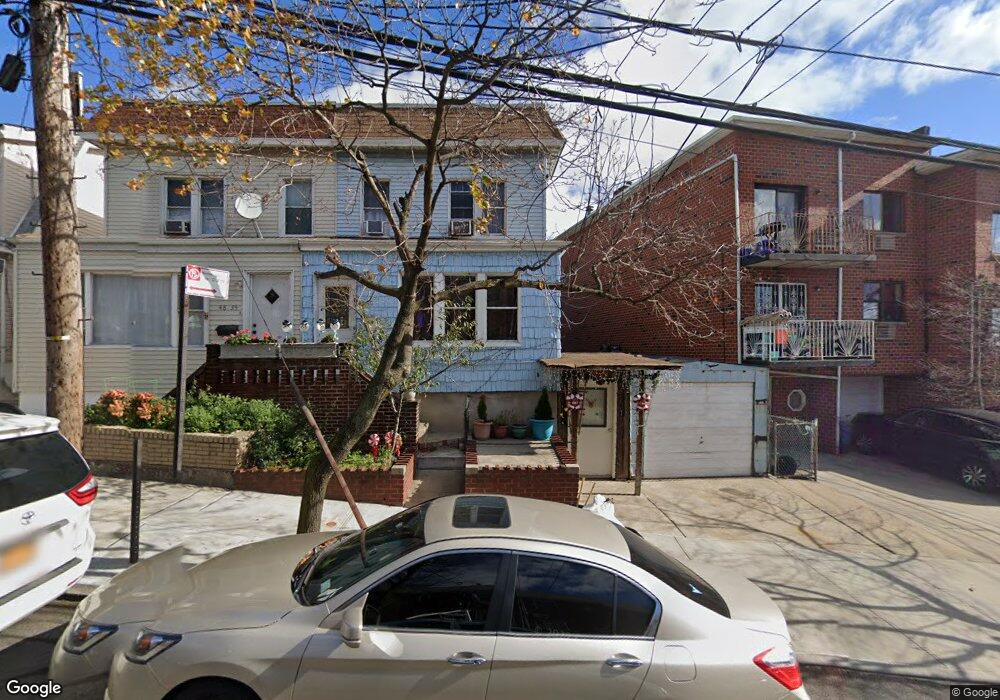
48-39 58th Ln Unit 2 Flushing, NY 11377
Woodside NeighborhoodEstimated Value: $924,959 - $1,179,000
4
Beds
1
Bath
1,792
Sq Ft
$591/Sq Ft
Est. Value
About This Home
This home is located at 48-39 58th Ln Unit 2, Flushing, NY 11377 and is currently estimated at $1,058,240, approximately $590 per square foot. 48-39 58th Ln Unit 2 is a home located in Queens County with nearby schools including P.S. 11 Kathryn Phelan, Is 5 The Walter Crowley Intermediate School, and William Cullen Bryant High School.
Ownership History
Date
Name
Owned For
Owner Type
Purchase Details
Closed on
Apr 24, 2006
Sold by
Vergara Bismarck and Vergara Fernando
Bought by
Monge Efrain
Current Estimated Value
Home Financials for this Owner
Home Financials are based on the most recent Mortgage that was taken out on this home.
Original Mortgage
$66,000
Outstanding Balance
$36,607
Interest Rate
6.34%
Estimated Equity
$1,021,633
Purchase Details
Closed on
Apr 7, 2000
Sold by
Amorosi Raymond A and Amorosi Lynda L
Bought by
Vergara Fernando and Vergara Bismarck
Home Financials for this Owner
Home Financials are based on the most recent Mortgage that was taken out on this home.
Original Mortgage
$278,850
Interest Rate
8.23%
Create a Home Valuation Report for This Property
The Home Valuation Report is an in-depth analysis detailing your home's value as well as a comparison with similar homes in the area
Home Values in the Area
Average Home Value in this Area
Purchase History
We collect this data history from publicly available records. To have your information removed, we recommend requesting removal directly through your county’s website.
| Date | Buyer | Sale Price | Title Company |
|---|---|---|---|
| Monge Efrain | $660,000 | -- | |
| Monge Efrain | $660,000 | -- | |
| Vergara Fernando | $294,000 | First American Title Ins Co | |
| Vergara Fernando | $294,000 | First American Title Ins Co |
Source: Public Records
Mortgage History
We collect this data history from publicly available records. To have your information removed, we recommend requesting removal directly through your county’s website.
| Date | Status | Borrower | Loan Amount |
|---|---|---|---|
| Open | Monge Efrain | $66,000 | |
| Closed | Monge Efrain | $66,000 | |
| Open | Monge Efrain | $528,000 | |
| Closed | Monge Efrain | $528,000 | |
| Previous Owner | Vergara Fernando | $278,850 |
Source: Public Records
Tax History
| Year | Tax Paid | Tax Assessment Tax Assessment Total Assessment is a certain percentage of the fair market value that is determined by local assessors to be the total taxable value of land and additions on the property. | Land | Improvement |
|---|---|---|---|---|
| 2026 | $6,217 | $32,809 | $9,391 | $23,418 |
| 2025 | $5,872 | $30,954 | $9,106 | $21,848 |
| 2024 | $5,872 | $29,237 | $9,621 | $19,616 |
| 2023 | $5,541 | $27,588 | $9,011 | $18,577 |
| 2022 | $5,507 | $52,380 | $18,480 | $33,900 |
| 2021 | $5,754 | $56,040 | $18,480 | $37,560 |
| 2020 | $5,460 | $61,620 | $18,480 | $43,140 |
| 2019 | $5,097 | $55,380 | $18,480 | $36,900 |
| 2018 | $4,686 | $22,990 | $8,311 | $14,679 |
| 2017 | $4,687 | $22,990 | $9,767 | $13,223 |
| 2016 | $4,555 | $22,990 | $9,767 | $13,223 |
| 2015 | $2,616 | $21,496 | $12,875 | $8,621 |
| 2014 | $2,616 | $20,304 | $14,588 | $5,716 |
Source: Public Records
Map
Nearby Homes
- 48-51 58th Ln
- 48-42 58th Ln
- 48-27 59th St
- 4801 58th Ln
- 4760 58th Ln
- 50-47 60th St
- 49-08/10 Queens Blvd
- 5801 Queens Blvd Unit 3A
- 5801 Queens Blvd Unit 10J
- 5801 Queens Blvd Unit 5M
- 5801 Queens Blvd Unit 6H
- 5801 Queens Blvd Unit 10D
- 5801 Queens Blvd Unit 7L
- 58-01 Queens Blvd Unit 11-F
- 58-01 Queens Blvd Unit 6K
- 58-01 Queens Blvd Unit 7C
- 58-01 Queens Blvd Unit 3-C
- 58-01 Queens Blvd Unit 2D
- 58-01 Queens Blvd Unit 3-A
- 58-01 Queens Blvd Unit 11-B
Your Personal Tour Guide
Ask me questions while you tour the home.