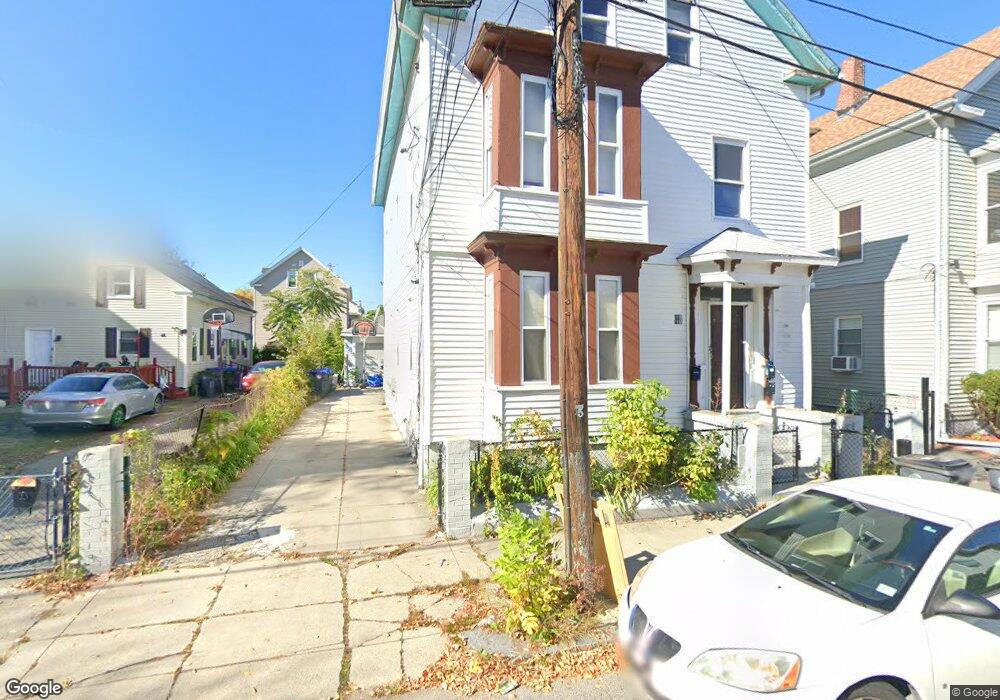
48 Alton St Providence, RI 02908
Valley NeighborhoodEstimated Value: $494,000 - $596,000
6
Beds
3
Baths
2,298
Sq Ft
$239/Sq Ft
Est. Value
About This Home
This home is located at 48 Alton St, Providence, RI 02908 and is currently estimated at $548,333, approximately $238 per square foot. 48 Alton St is a home located in Providence County with nearby schools including Blessed Sacrament School, Holy Ghost School, and Mount Pleasant Academy.
Ownership History
Date
Name
Owned For
Owner Type
Purchase Details
Closed on
Jun 10, 2024
Sold by
Mai Lys and Su Hoan
Bought by
Su Kathy and Su Hoan V
Current Estimated Value
Purchase Details
Closed on
Apr 19, 2010
Sold by
Deutsche Bank Natl T C
Bought by
Su Daniel and Mai Lys
Purchase Details
Closed on
Nov 9, 2009
Sold by
Lantigua Dulce M and Deutsche Bank Natl T C
Bought by
Deutsche Bank Natl T C
Purchase Details
Closed on
May 25, 2006
Sold by
Lopez Hector and Lopez Irma
Bought by
Lantigua Dulce M
Home Financials for this Owner
Home Financials are based on the most recent Mortgage that was taken out on this home.
Original Mortgage
$242,250
Interest Rate
6.53%
Mortgage Type
Purchase Money Mortgage
Create a Home Valuation Report for This Property
The Home Valuation Report is an in-depth analysis detailing your home's value as well as a comparison with similar homes in the area
Home Values in the Area
Average Home Value in this Area
Purchase History
| Date | Buyer | Sale Price | Title Company |
|---|---|---|---|
| Su Kathy | -- | None Available | |
| Su Kathy | -- | None Available | |
| Su Daniel | $52,000 | -- | |
| Su Daniel | $52,000 | -- | |
| Deutsche Bank Natl T C | $149,880 | -- | |
| Deutsche Bank Natl T C | $149,880 | -- | |
| Lantigua Dulce M | $285,000 | -- | |
| Lantigua Dulce M | $285,000 | -- |
Source: Public Records
Mortgage History
| Date | Status | Borrower | Loan Amount |
|---|---|---|---|
| Previous Owner | Lantigua Dulce M | $242,250 | |
| Previous Owner | Lantigua Dulce M | $28,500 |
Source: Public Records
Tax History
| Year | Tax Paid | Tax Assessment Tax Assessment Total Assessment is a certain percentage of the fair market value that is determined by local assessors to be the total taxable value of land and additions on the property. | Land | Improvement |
|---|---|---|---|---|
| 2025 | $6,254 | $446,700 | $111,400 | $335,300 |
| 2024 | $5,373 | $292,800 | $67,700 | $225,100 |
| 2023 | $5,373 | $292,800 | $67,700 | $225,100 |
| 2022 | $5,212 | $292,800 | $67,700 | $225,100 |
| 2021 | $4,588 | $186,800 | $45,500 | $141,300 |
| 2020 | $4,588 | $186,800 | $45,500 | $141,300 |
| 2019 | $4,588 | $186,800 | $45,500 | $141,300 |
| 2018 | $3,659 | $114,500 | $35,800 | $78,700 |
| 2017 | $3,659 | $114,500 | $35,800 | $78,700 |
| 2016 | $3,659 | $114,500 | $35,800 | $78,700 |
| 2015 | $3,694 | $111,600 | $44,100 | $67,500 |
| 2014 | $3,767 | $111,600 | $44,100 | $67,500 |
| 2013 | $3,767 | $111,600 | $44,100 | $67,500 |
Source: Public Records
Map
Nearby Homes
Your Personal Tour Guide
Ask me questions while you tour the home.