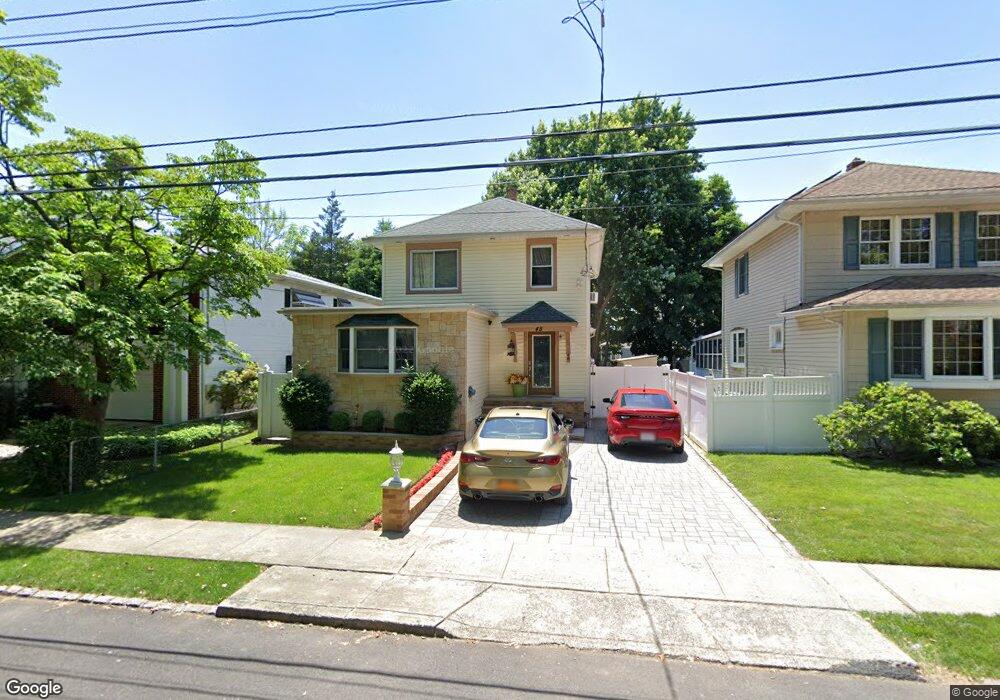
48 Bache Ave Staten Island, NY 10306
New Dorp NeighborhoodEstimated Value: $761,272 - $877,000
--
Bed
4
Baths
1,700
Sq Ft
$494/Sq Ft
Est. Value
About This Home
This home is located at 48 Bache Ave, Staten Island, NY 10306 and is currently estimated at $839,068, approximately $493 per square foot. 48 Bache Ave is a home located in Richmond County with nearby schools including P.S. 41 The Stephanie a Vierno School, Is 2 George L Egbert, and New Dorp High School.
Ownership History
Date
Name
Owned For
Owner Type
Purchase Details
Closed on
Apr 1, 2006
Sold by
Ross Leonard J and Ross Renee D
Bought by
Ross Renee D
Current Estimated Value
Purchase Details
Closed on
May 4, 2001
Sold by
Lima Virginia and Ross Leonard J
Bought by
Ross Leonard J and Ross Renee D
Create a Home Valuation Report for This Property
The Home Valuation Report is an in-depth analysis detailing your home's value as well as a comparison with similar homes in the area
Home Values in the Area
Average Home Value in this Area
Purchase History
| Date | Buyer | Sale Price | Title Company |
|---|---|---|---|
| Ross Renee D | -- | Fidelity National Title Insu | |
| Ross Leonard J | -- | -- |
Source: Public Records
Tax History Compared to Growth
Tax History
| Year | Tax Paid | Tax Assessment Tax Assessment Total Assessment is a certain percentage of the fair market value that is determined by local assessors to be the total taxable value of land and additions on the property. | Land | Improvement |
|---|---|---|---|---|
| 2025 | $6,735 | $53,100 | $7,703 | $45,397 |
| 2024 | $6,735 | $56,700 | $6,813 | $49,887 |
| 2023 | $6,461 | $31,814 | $6,265 | $25,549 |
| 2022 | $6,008 | $49,680 | $11,520 | $38,160 |
| 2021 | $6,334 | $45,360 | $11,520 | $33,840 |
| 2020 | $6,263 | $40,740 | $11,520 | $29,220 |
| 2019 | $5,846 | $40,920 | $11,520 | $29,400 |
| 2018 | $5,404 | $26,512 | $8,962 | $17,550 |
| 2017 | $5,113 | $25,081 | $8,162 | $16,919 |
| 2016 | $5,014 | $25,081 | $8,708 | $16,373 |
| 2015 | $4,469 | $24,657 | $7,543 | $17,114 |
| 2014 | $4,469 | $23,288 | $8,546 | $14,742 |
Source: Public Records
Map
Nearby Homes