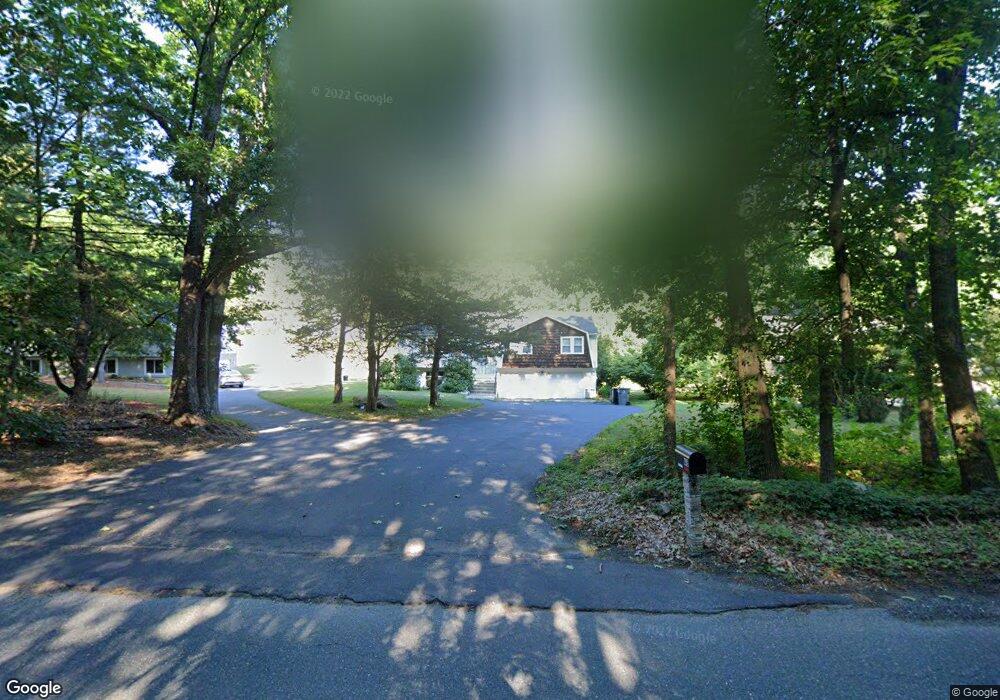
48 Badger Rd Framingham, MA 01702
Estimated Value: $815,000 - $898,000
5
Beds
3
Baths
2,828
Sq Ft
$298/Sq Ft
Est. Value
About This Home
This home is located at 48 Badger Rd, Framingham, MA 01702 and is currently estimated at $843,058, approximately $298 per square foot. 48 Badger Rd is a home located in Middlesex County with nearby schools including Framingham High School, Pincushion Hill Montessori School, and Summit Montessori School.
Ownership History
Date
Name
Owned For
Owner Type
Purchase Details
Closed on
Nov 1, 2010
Sold by
Fhlmc
Bought by
Wong Andrew K
Current Estimated Value
Home Financials for this Owner
Home Financials are based on the most recent Mortgage that was taken out on this home.
Original Mortgage
$187,400
Outstanding Balance
$124,398
Interest Rate
4.39%
Mortgage Type
Purchase Money Mortgage
Estimated Equity
$718,660
Purchase Details
Closed on
Feb 19, 2010
Sold by
Suntrust Mtg Inc and Truong
Bought by
Fhlmc
Purchase Details
Closed on
Jul 27, 2005
Sold by
Duong Hong Quang and Pham Tuyet
Bought by
Truong Hoa
Purchase Details
Closed on
Oct 1, 2003
Sold by
Chuang Ian T and Chuang Ian T
Bought by
Duong Hong Quang and Pham Tuyet
Purchase Details
Closed on
Jun 29, 1990
Sold by
Porter Leslie R
Bought by
Chuang Ian T
Create a Home Valuation Report for This Property
The Home Valuation Report is an in-depth analysis detailing your home's value as well as a comparison with similar homes in the area
Home Values in the Area
Average Home Value in this Area
Purchase History
| Date | Buyer | Sale Price | Title Company |
|---|---|---|---|
| Wong Andrew K | $238,000 | -- | |
| Wong Andrew K | $238,000 | -- | |
| Fhlmc | $264,141 | -- | |
| Fhlmc | $264,141 | -- | |
| Truong Hoa | $350,000 | -- | |
| Truong Hoa | $350,000 | -- | |
| Duong Hong Quang | $350,000 | -- | |
| Duong Hong Quang | $350,000 | -- | |
| Chuang Ian T | $35,000 | -- | |
| Chuang Ian T | $175,000 | -- | |
| Chuang Ian T | $175,000 | -- | |
| Chuang Ian T | $175,000 | -- |
Source: Public Records
Mortgage History
| Date | Status | Borrower | Loan Amount |
|---|---|---|---|
| Open | Wong Andrew K | $187,400 | |
| Closed | Chuang Ian T | $25,000 | |
| Closed | Chuang Ian T | $187,400 |
Source: Public Records
Tax History
| Year | Tax Paid | Tax Assessment Tax Assessment Total Assessment is a certain percentage of the fair market value that is determined by local assessors to be the total taxable value of land and additions on the property. | Land | Improvement |
|---|---|---|---|---|
| 2025 | $8,077 | $676,500 | $291,700 | $384,800 |
| 2024 | $7,743 | $621,400 | $260,000 | $361,400 |
| 2023 | $7,321 | $559,300 | $232,000 | $327,300 |
| 2022 | $7,027 | $511,400 | $210,900 | $300,500 |
| 2021 | $7,081 | $504,000 | $202,700 | $301,300 |
| 2020 | $7,180 | $479,300 | $184,400 | $294,900 |
| 2019 | $7,033 | $457,300 | $184,400 | $272,900 |
| 2018 | $6,871 | $421,000 | $180,800 | $240,200 |
| 2017 | $6,691 | $400,400 | $175,500 | $224,900 |
| 2016 | $6,632 | $381,600 | $177,100 | $204,500 |
| 2015 | $6,813 | $382,300 | $176,900 | $205,400 |
Source: Public Records
Map
Nearby Homes
- 14 Travis Dr
- 34 Jodie Rd
- 87 Hilldale Rd
- 1500 Worcester Rd Unit 221
- 1500 Worcester Rd Unit 118
- 1500 Worcester Rd Unit 426
- 95 Pine Hill Rd
- 1550 Worcester Rd Unit 101
- 81 Edgewater Dr
- 22 Gryzboska Cir
- 37 Riverview Dr
- 94 Myrtle St
- 0 Oregon Rd
- 45 Gates St
- 1116 Waverley
- 15 Bellmore Rd
- 1321 Worcester Rd Unit 603
- 1321 Worcester Rd Unit 201
- 1321 Worcester Rd Unit 610
- 12 & 14 Waverly St
- 46 Badger Rd
- 52 Badger Rd
- 44 Badger Rd
- 11 Cahill Park Dr
- 9 Cahill Park Dr
- 15 Cahill Park Dr
- 7 Cahill Park Dr
- 54 Badger Rd
- 19 Cahill Park Dr
- 17 Cahill Park Dr
- 5 Cahill Park Dr
- 2 Louis w Farley Dr
- 21 Cahill Park Dr
- 3 Cahill Park Dr
- 14 Cahill Park Dr
- 10 Cahill Park Dr
- 34 Hickory Hill Ln
- 8 Cahill Park Dr
- 4 Louis w Farley Dr
- 18 Cahill Park Dr
Your Personal Tour Guide
Ask me questions while you tour the home.