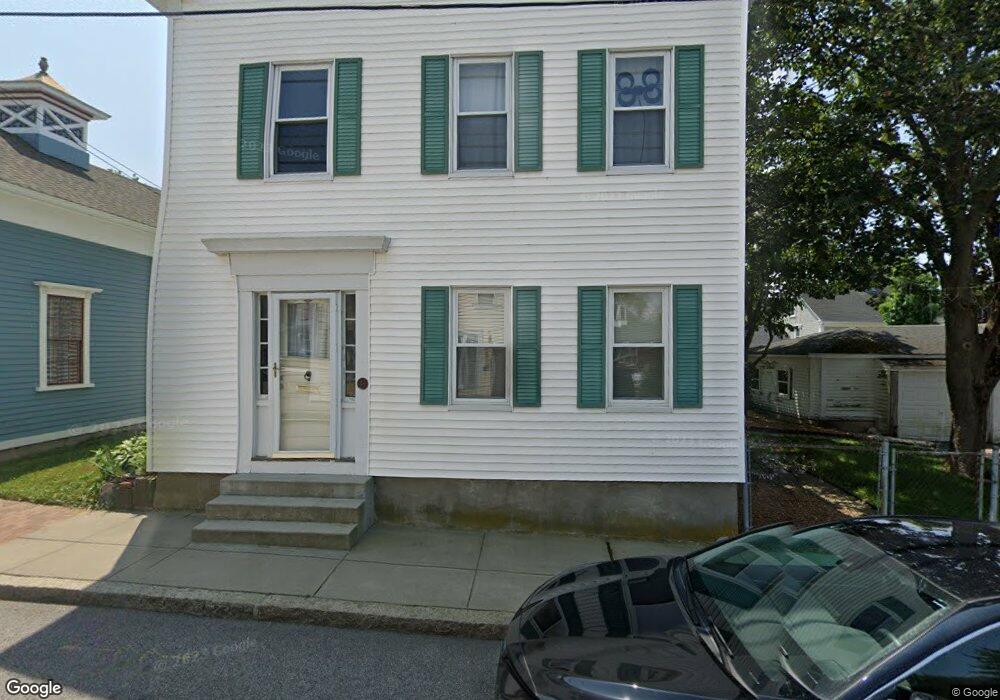
48 Baker St Warren, RI 02885
Downtown Warren NeighborhoodEstimated Value: $490,000 - $601,000
7
Beds
2
Baths
2,440
Sq Ft
$230/Sq Ft
Est. Value
About This Home
This home is located at 48 Baker St, Warren, RI 02885 and is currently estimated at $560,401, approximately $229 per square foot. 48 Baker St is a home located in Bristol County with nearby schools including Mt. Hope High School, Highlander Charter Middle and High School, and East Bay Career Academy.
Ownership History
Date
Name
Owned For
Owner Type
Purchase Details
Closed on
Jun 14, 1993
Sold by
Diniz Joseph R and Diniz Rai A
Bought by
Diniz Joseph R and Diniz Theresa
Current Estimated Value
Create a Home Valuation Report for This Property
The Home Valuation Report is an in-depth analysis detailing your home's value as well as a comparison with similar homes in the area
Home Values in the Area
Average Home Value in this Area
Purchase History
| Date | Buyer | Sale Price | Title Company |
|---|---|---|---|
| Diniz Joseph R | $55,000 | -- |
Source: Public Records
Mortgage History
| Date | Status | Borrower | Loan Amount |
|---|---|---|---|
| Open | Diniz Joseph R | $123,800 | |
| Closed | Diniz Joseph R | $175,000 | |
| Closed | Diniz Joseph R | $66,000 | |
| Closed | Diniz Joseph R | $25,000 |
Source: Public Records
Tax History
| Year | Tax Paid | Tax Assessment Tax Assessment Total Assessment is a certain percentage of the fair market value that is determined by local assessors to be the total taxable value of land and additions on the property. | Land | Improvement |
|---|---|---|---|---|
| 2025 | $6,231 | $418,500 | $169,700 | $248,800 |
| 2024 | $6,043 | $418,500 | $169,700 | $248,800 |
| 2023 | $5,717 | $418,500 | $169,700 | $248,800 |
| 2022 | $4,796 | $266,300 | $106,900 | $159,400 |
| 2021 | $4,719 | $266,300 | $106,900 | $159,400 |
| 2020 | $4,623 | $266,300 | $106,900 | $159,400 |
| 2019 | $3,809 | $199,300 | $85,600 | $113,700 |
| 2018 | $3,759 | $199,300 | $85,600 | $113,700 |
| 2017 | $3,749 | $199,300 | $85,600 | $113,700 |
| 2016 | $4,158 | $208,200 | $68,900 | $139,300 |
| 2015 | $4,158 | $208,200 | $68,900 | $139,300 |
| 2014 | $4,179 | $208,200 | $68,900 | $139,300 |
Source: Public Records
Map
Nearby Homes
Your Personal Tour Guide
Ask me questions while you tour the home.