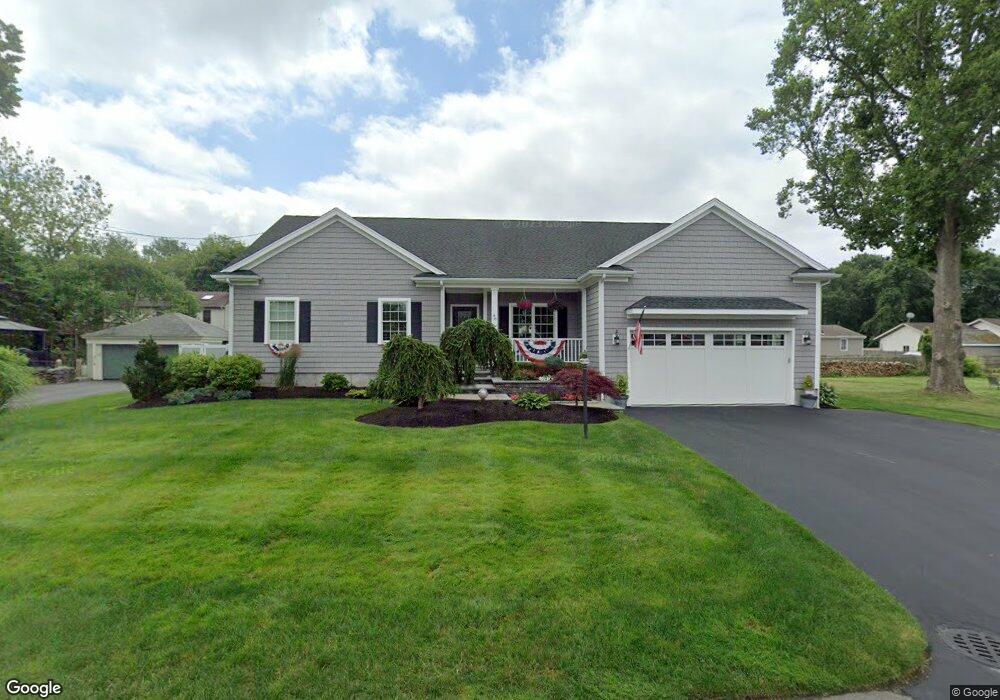
48 Beach Rd Bristol, RI 02809
Bristol Highlands NeighborhoodEstimated Value: $699,000 - $922,000
Studio
--
Bath
1,964
Sq Ft
$421/Sq Ft
Est. Value
About This Home
This home is located at 48 Beach Rd, Bristol, RI 02809 and is currently estimated at $825,924, approximately $420 per square foot. 48 Beach Rd is a home with nearby schools including Mt. Hope High School, Highlander Charter Middle and High School, and Our Lady of Mt. Carmel School.
Ownership History
Date
Name
Owned For
Owner Type
Purchase Details
Closed on
Apr 11, 2024
Sold by
Gablinske Wayne A and Gablinske Linda M
Bought by
W A & L M Gablinske Ft and Gablinske
Current Estimated Value
Purchase Details
Closed on
Mar 19, 2015
Sold by
Rosewood Prpoerty Ent
Bought by
Gablinske Wayne A and Gablinske Linda M
Create a Home Valuation Report for This Property
The Home Valuation Report is an in-depth analysis detailing your home's value as well as a comparison with similar homes in the area
Home Values in the Area
Average Home Value in this Area
Purchase History
| Date | Buyer | Sale Price | Title Company |
|---|---|---|---|
| W A & L M Gablinske Ft | -- | None Available | |
| Gablinske Wayne A | $137,500 | -- |
Source: Public Records
Mortgage History
| Date | Status | Borrower | Loan Amount |
|---|---|---|---|
| Previous Owner | Gablinske Wayne A | $87,000 | |
| Previous Owner | Gablinske Wayne A | $225,000 |
Source: Public Records
Tax History
| Year | Tax Paid | Tax Assessment Tax Assessment Total Assessment is a certain percentage of the fair market value that is determined by local assessors to be the total taxable value of land and additions on the property. | Land | Improvement |
|---|---|---|---|---|
| 2025 | $7,960 | $576,000 | $172,700 | $403,300 |
| 2024 | $7,960 | $576,000 | $172,700 | $403,300 |
| 2023 | $7,695 | $576,000 | $172,700 | $403,300 |
| 2022 | $7,488 | $576,000 | $172,700 | $403,300 |
| 2021 | $7,506 | $522,000 | $171,700 | $350,300 |
| 2020 | $7,345 | $522,000 | $171,700 | $350,300 |
| 2019 | $8,248 | $601,200 | $171,700 | $429,500 |
| 2018 | $6,280 | $408,300 | $172,800 | $235,500 |
| 2017 | $5,331 | $357,300 | $156,100 | $201,200 |
| 2016 | $5,277 | $357,300 | $156,100 | $201,200 |
| 2015 | $2,190 | $156,100 | $156,100 | $0 |
| 2014 | $849 | $65,000 | $65,000 | $0 |
Source: Public Records
Map
Nearby Homes
- 0 Surf Dr
- 29 Forest Rd
- 1270 Hope St
- 35 Seabreeze Ln
- 1220 Hope St
- 1 Knowlton Ct
- 506 Clarks Row
- 461 North Ln
- 1 Hydraulion Ave
- 417 North Ln
- 1382 Hope St
- 3 Knowlton Ct
- 7 Knowlton Ct
- 5 Knowlton Ct
- 2 Bagy Wrinkle Cove
- 35 Bagy Wrinkle Cove
- 39 Bagy Wrinkle Cove
- 669 Metacom Ave Unit 25
- 677 Metacom Ave Unit 64
- 5 Saint Theresa Ave
Your Personal Tour Guide
Ask me questions while you tour the home.