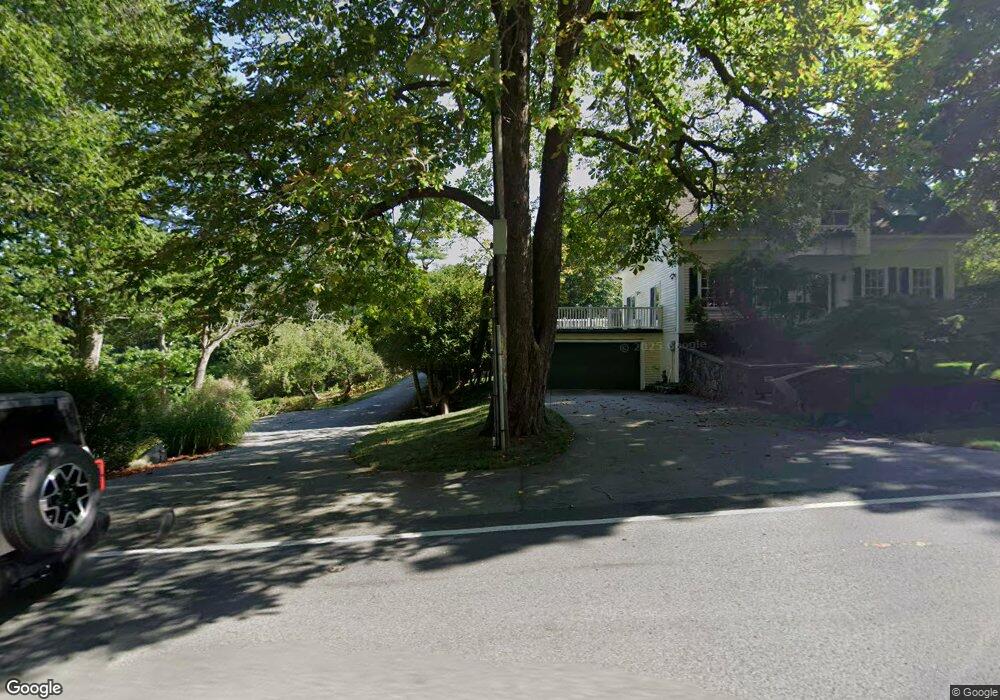
48 Bridge St Manchester, MA 01944
Estimated Value: $1,561,000 - $2,952,000
5
Beds
5
Baths
4,297
Sq Ft
$521/Sq Ft
Est. Value
About This Home
This home is located at 48 Bridge St, Manchester, MA 01944 and is currently estimated at $2,239,091, approximately $521 per square foot. 48 Bridge St is a home located in Essex County with nearby schools including Manchester Essex Regional High School, Tara Montessori School, and Glen Urquhart School.
Ownership History
Date
Name
Owned For
Owner Type
Purchase Details
Closed on
Oct 14, 2005
Sold by
Congdon Bradford A and Congdon Monika E
Bought by
Emerson Christopher J and Emerson Faith D
Current Estimated Value
Purchase Details
Closed on
Jul 25, 1996
Sold by
Mitchell Helen L
Bought by
Congdon Bradford A and Congdon Monika E
Create a Home Valuation Report for This Property
The Home Valuation Report is an in-depth analysis detailing your home's value as well as a comparison with similar homes in the area
Home Values in the Area
Average Home Value in this Area
Purchase History
| Date | Buyer | Sale Price | Title Company |
|---|---|---|---|
| Emerson Christopher J | $1,487,500 | -- | |
| Congdon Bradford A | $375,000 | -- |
Source: Public Records
Mortgage History
| Date | Status | Borrower | Loan Amount |
|---|---|---|---|
| Open | Congdon Bradford A | $417,000 | |
| Closed | Congdon Bradford A | $464,000 |
Source: Public Records
Tax History
| Year | Tax Paid | Tax Assessment Tax Assessment Total Assessment is a certain percentage of the fair market value that is determined by local assessors to be the total taxable value of land and additions on the property. | Land | Improvement |
|---|---|---|---|---|
| 2025 | $16,403 | $1,792,700 | $809,500 | $983,200 |
| 2024 | $15,708 | $1,680,000 | $809,500 | $870,500 |
| 2023 | $15,425 | $1,478,900 | $725,700 | $753,200 |
| 2022 | $15,041 | $1,419,000 | $703,400 | $715,600 |
| 2021 | $15,389 | $1,400,300 | $703,400 | $696,900 |
| 2020 | $16,306 | $1,393,700 | $703,400 | $690,300 |
| 2019 | $15,046 | $1,339,800 | $669,900 | $669,900 |
| 2018 | $14,778 | $1,339,800 | $669,900 | $669,900 |
| 2017 | $14,124 | $1,284,000 | $614,100 | $669,900 |
| 2016 | $13,596 | $1,228,200 | $614,100 | $614,100 |
| 2015 | $12,708 | $1,172,300 | $558,200 | $614,100 |
Source: Public Records
Map
Nearby Homes
Your Personal Tour Guide
Ask me questions while you tour the home.