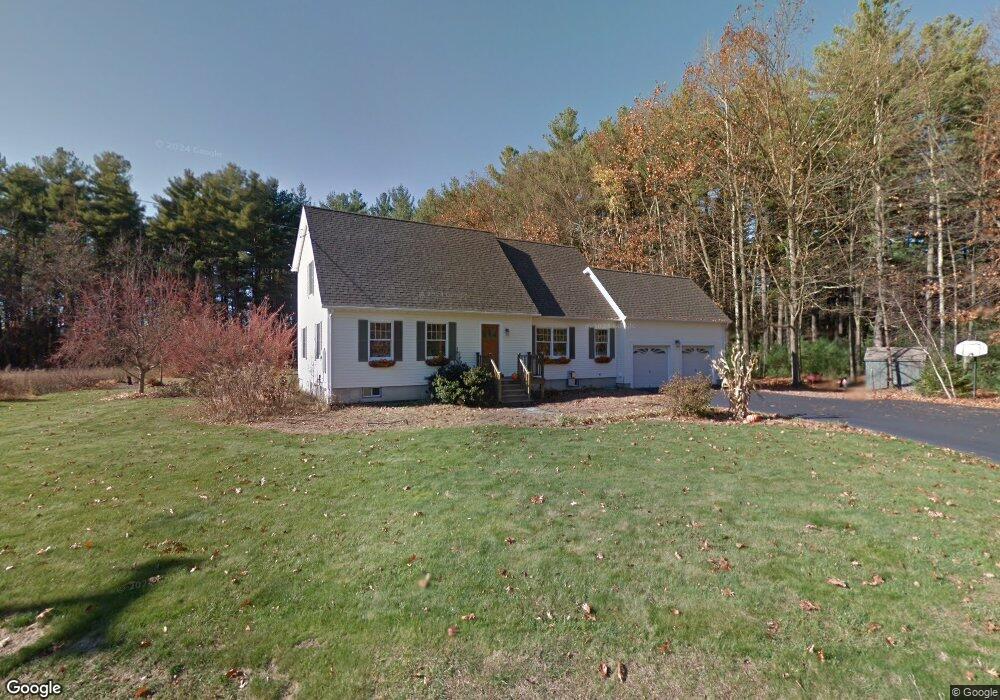
48 Brook St Easthampton, MA 01027
Estimated Value: $597,000 - $700,630
4
Beds
3
Baths
2,398
Sq Ft
$269/Sq Ft
Est. Value
About This Home
This home is located at 48 Brook St, Easthampton, MA 01027 and is currently estimated at $645,908, approximately $269 per square foot. 48 Brook St is a home located in Hampshire County with nearby schools including Easthampton High School, Tri-County Schools, and New England Adolescent Research Institute.
Ownership History
Date
Name
Owned For
Owner Type
Purchase Details
Closed on
Dec 30, 2014
Sold by
Atwater Jennifer S and Miller Jennifer S
Bought by
Jennifer S Atwater T
Current Estimated Value
Purchase Details
Closed on
Apr 16, 2003
Sold by
Miller Ralph R
Bought by
Miller Jennifer S
Create a Home Valuation Report for This Property
The Home Valuation Report is an in-depth analysis detailing your home's value as well as a comparison with similar homes in the area
Home Values in the Area
Average Home Value in this Area
Purchase History
| Date | Buyer | Sale Price | Title Company |
|---|---|---|---|
| Jennifer S Atwater T | -- | -- | |
| Miller Jennifer S | -- | -- |
Source: Public Records
Mortgage History
| Date | Status | Borrower | Loan Amount |
|---|---|---|---|
| Previous Owner | Miller Jennifer S | $73,000 | |
| Previous Owner | Miller Jennifer S | $90,000 |
Source: Public Records
Tax History
| Year | Tax Paid | Tax Assessment Tax Assessment Total Assessment is a certain percentage of the fair market value that is determined by local assessors to be the total taxable value of land and additions on the property. | Land | Improvement |
|---|---|---|---|---|
| 2025 | $8,421 | $616,000 | $187,000 | $429,000 |
| 2024 | $8,330 | $614,300 | $196,400 | $417,900 |
| 2023 | $6,355 | $433,800 | $162,900 | $270,900 |
| 2022 | $7,171 | $433,800 | $162,900 | $270,900 |
| 2021 | $7,900 | $450,400 | $162,900 | $287,500 |
| 2020 | $7,704 | $433,800 | $162,900 | $270,900 |
| 2019 | $6,668 | $431,300 | $162,900 | $268,400 |
| 2018 | $6,438 | $402,400 | $154,500 | $247,900 |
| 2017 | $6,291 | $388,100 | $149,000 | $239,100 |
| 2016 | $6,096 | $391,000 | $149,000 | $242,000 |
| 2015 | $5,924 | $391,000 | $149,000 | $242,000 |
Source: Public Records
Map
Nearby Homes
Your Personal Tour Guide
Ask me questions while you tour the home.