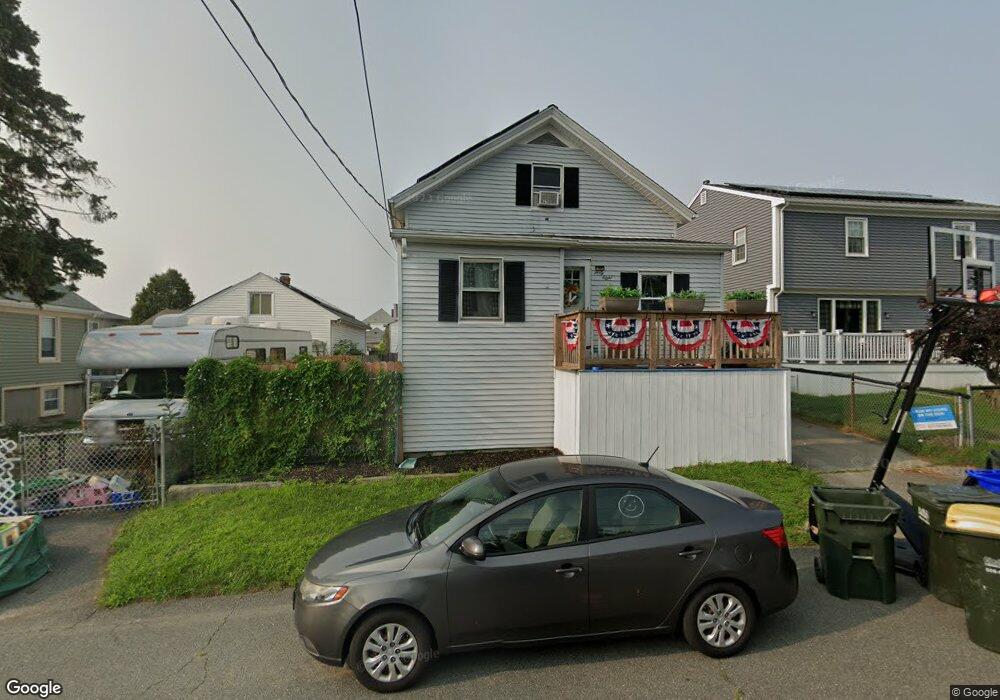
48 Byron St Fall River, MA 02724
Sandy Beach NeighborhoodEstimated Value: $375,000 - $503,000
3
Beds
2
Baths
1,565
Sq Ft
$270/Sq Ft
Est. Value
About This Home
This home is located at 48 Byron St, Fall River, MA 02724 and is currently estimated at $422,413, approximately $269 per square foot. 48 Byron St is a home located in Bristol County with nearby schools including Henry Lord Community School, B M C Durfee High School, and Argosy Collegiate Charter School.
Ownership History
Date
Name
Owned For
Owner Type
Purchase Details
Closed on
Mar 11, 2022
Sold by
Viveiros David J and Dionne Michelle M
Bought by
Viveiros David J
Current Estimated Value
Home Financials for this Owner
Home Financials are based on the most recent Mortgage that was taken out on this home.
Original Mortgage
$225,022
Outstanding Balance
$208,551
Interest Rate
3.55%
Mortgage Type
FHA
Estimated Equity
$213,862
Purchase Details
Closed on
Jan 27, 2021
Sold by
Dionne Michelle M
Bought by
Dionne Michelle M and Viveiros David J
Purchase Details
Closed on
Jul 14, 2011
Sold by
Turgeon Arlene D
Bought by
Dionne Michelle M
Home Financials for this Owner
Home Financials are based on the most recent Mortgage that was taken out on this home.
Original Mortgage
$82,500
Interest Rate
4.58%
Create a Home Valuation Report for This Property
The Home Valuation Report is an in-depth analysis detailing your home's value as well as a comparison with similar homes in the area
Home Values in the Area
Average Home Value in this Area
Purchase History
| Date | Buyer | Sale Price | Title Company |
|---|---|---|---|
| Viveiros David J | -- | None Available | |
| Viveiros David J | -- | None Available | |
| Dionne Michelle M | -- | None Available | |
| Dionne Michelle M | -- | None Available | |
| Dionne Michelle M | $110,000 | -- | |
| Dionne Michelle M | $110,000 | -- | |
| Dionne Michelle M | $110,000 | -- |
Source: Public Records
Mortgage History
| Date | Status | Borrower | Loan Amount |
|---|---|---|---|
| Open | Viveiros David J | $225,022 | |
| Closed | Viveiros David J | $225,022 | |
| Previous Owner | Dionne Michelle M | $82,500 | |
| Previous Owner | Dionne Michelle M | $13,724 |
Source: Public Records
Tax History
| Year | Tax Paid | Tax Assessment Tax Assessment Total Assessment is a certain percentage of the fair market value that is determined by local assessors to be the total taxable value of land and additions on the property. | Land | Improvement |
|---|---|---|---|---|
| 2025 | $3,389 | $296,000 | $114,300 | $181,700 |
| 2024 | $3,177 | $276,500 | $112,100 | $164,400 |
| 2023 | $3,174 | $258,700 | $101,000 | $157,700 |
| 2022 | $2,804 | $222,200 | $95,200 | $127,000 |
| 2021 | $2,626 | $189,900 | $91,000 | $98,900 |
| 2020 | $2,163 | $149,700 | $86,800 | $62,900 |
| 2019 | $2,238 | $153,500 | $90,800 | $62,700 |
| 2018 | $2,165 | $148,100 | $91,400 | $56,700 |
| 2017 | $2,031 | $145,100 | $91,400 | $53,700 |
| 2016 | $2,064 | $151,400 | $94,200 | $57,200 |
| 2015 | $1,971 | $150,700 | $94,200 | $56,500 |
| 2014 | $1,896 | $150,700 | $94,200 | $56,500 |
Source: Public Records
Map
Nearby Homes
- 24 Valley St
- 391 Clarkson St
- 39 Hilton St
- 579 Summit St Unit 3
- 579 Summit St Unit 2
- 616 Woodman St
- 126 Wheeler St
- 30 Broad St
- 2229 S Main St
- 310 King Philip St
- 245 Dwelly St
- 25 Mathew Rd
- 464 Birch St
- 29 Robert St
- 609 King Philip St
- 15 Higgins St
- 57 Larouche St
- 1852 S Main St
- 1846 S Main St
- 12 Horizon Dr
Your Personal Tour Guide
Ask me questions while you tour the home.