48 Camellia Place Oakland, CA 94602
Lincoln Highlands NeighborhoodEstimated Value: $1,335,000 - $1,966,681
4
Beds
3
Baths
4,202
Sq Ft
$382/Sq Ft
Est. Value
About This Home
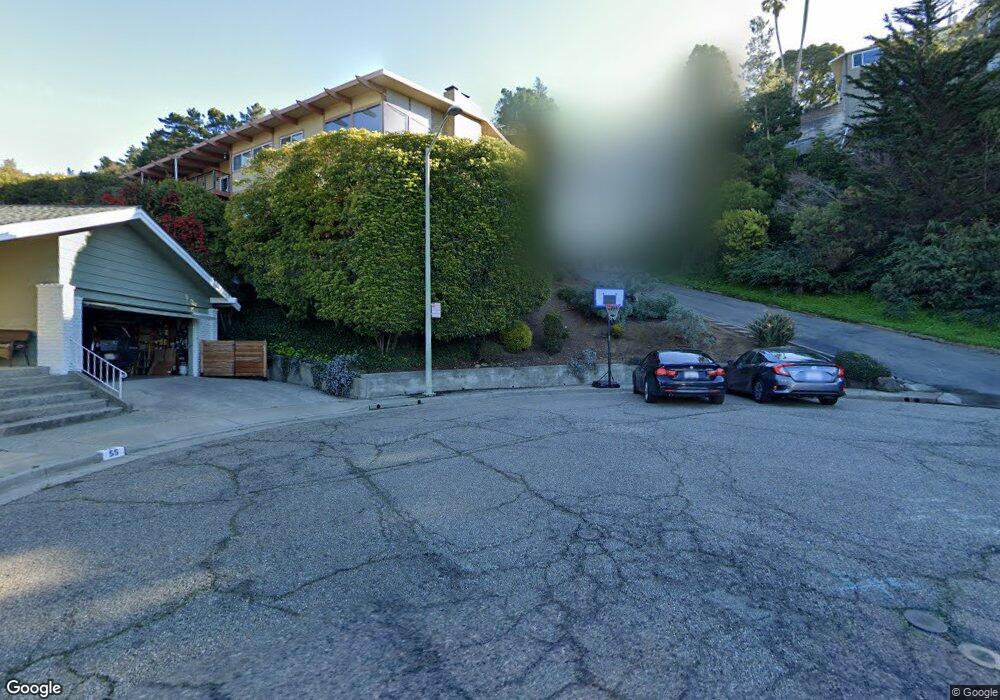
This home is located at 48 Camellia Place, Oakland, CA 94602 and is currently estimated at $1,603,670, approximately $381 per square foot. 48 Camellia Place is a home located in Alameda County with nearby schools including Sequoia Elementary School, Bret Harte Middle School, and Skyline High School.
Ownership History
Date
Name
Owned For
Owner Type
Purchase Details
Closed on
Feb 20, 2018
Sold by
Lau Sheila C and Lau Eddy T
Bought by
Lau Sheila C and Lau Eddy T
Current Estimated Value
Purchase Details
Closed on
Dec 9, 2014
Sold by
Canida Christy L and Wilhelm Eric J
Bought by
Canida Christy L
Purchase Details
Closed on
Aug 2, 2004
Sold by
Dotson Kenneth W and Dotson Panchetta
Bought by
Wilhelm Eric J and Canida Christy L
Home Financials for this Owner
Home Financials are based on the most recent Mortgage that was taken out on this home.
Original Mortgage
$255,000
Outstanding Balance
$128,461
Interest Rate
6.24%
Mortgage Type
Purchase Money Mortgage
Estimated Equity
$1,475,209
Purchase Details
Closed on
Nov 22, 2000
Sold by
Dotson Kenneth
Bought by
Dotson Panchetta
Create a Home Valuation Report for This Property
The Home Valuation Report is an in-depth analysis detailing your home's value as well as a comparison with similar homes in the area
Home Values in the Area
Average Home Value in this Area
Purchase History
| Date | Buyer | Sale Price | Title Company |
|---|---|---|---|
| Lau Sheila C | -- | None Available | |
| Canida Christy L | -- | None Available | |
| Wilhelm Eric J | $655,000 | Fidelity National Title Co | |
| Dotson Panchetta | -- | First American Title Guarant |
Source: Public Records
Mortgage History
| Date | Status | Borrower | Loan Amount |
|---|---|---|---|
| Open | Wilhelm Eric J | $255,000 |
Source: Public Records
Tax History Compared to Growth
Tax History
| Year | Tax Paid | Tax Assessment Tax Assessment Total Assessment is a certain percentage of the fair market value that is determined by local assessors to be the total taxable value of land and additions on the property. | Land | Improvement |
|---|---|---|---|---|
| 2025 | $18,983 | $1,379,433 | $273,877 | $1,112,556 |
| 2024 | $18,983 | $1,352,254 | $268,509 | $1,090,745 |
| 2023 | $20,073 | $1,332,607 | $263,245 | $1,069,362 |
| 2022 | $19,642 | $1,299,483 | $258,085 | $1,048,398 |
| 2021 | $18,997 | $1,273,869 | $253,025 | $1,027,844 |
| 2020 | $18,791 | $1,267,738 | $250,431 | $1,017,307 |
| 2019 | $18,221 | $1,242,888 | $245,522 | $997,366 |
| 2018 | $17,836 | $1,218,527 | $240,710 | $977,817 |
| 2017 | $17,205 | $1,194,641 | $235,992 | $958,649 |
| 2016 | $16,768 | $1,171,222 | $231,366 | $939,856 |
| 2015 | $13,463 | $917,641 | $227,892 | $689,749 |
| 2014 | $11,461 | $744,767 | $223,430 | $521,337 |
Source: Public Records
Map
Nearby Homes
- 37 Coolidge Terrace
- 2818 Steinmetz Way
- 4751 Lincoln Ave
- 180 Maiden Ln
- 4271 Whittle Ave
- 2471 Burlington St
- 3073 Monterey Blvd
- 2907 Jordan Rd
- 3085 Monterey Blvd
- 2436 Potomac St
- 4258 Maple Ave
- 5040 Pierpoint Ave
- 1975 Wrenn St
- 4445 Arcadia Ave
- 2093 Braemar Rd
- 2808 Carmel St
- 1989 Oakview Dr
- 2510 Delmer St
- 3875 Coolidge Ave
- 3873 Coolidge Ave
- 65 Camellia Place
- 48 Coolidge Terrace
- 54 Camellia Place
- 49 Coolidge Terrace
- 60 Camellia Place
- 55 Camellia Place
- 42 Coolidge Terrace
- 40 Camellia Place
- 43 Coolidge Terrace
- 45 Camellia Place
- 36 Coolidge Terrace
- 32 Camellia Place
- 35 Camellia Place
- 2560 Charleston St
- 24 Camellia Place
- 25 Camellia Place
- 30 Coolidge Terrace
- 31 Coolidge Terrace
- 15 Camellia Place
- 18 Camellia Place