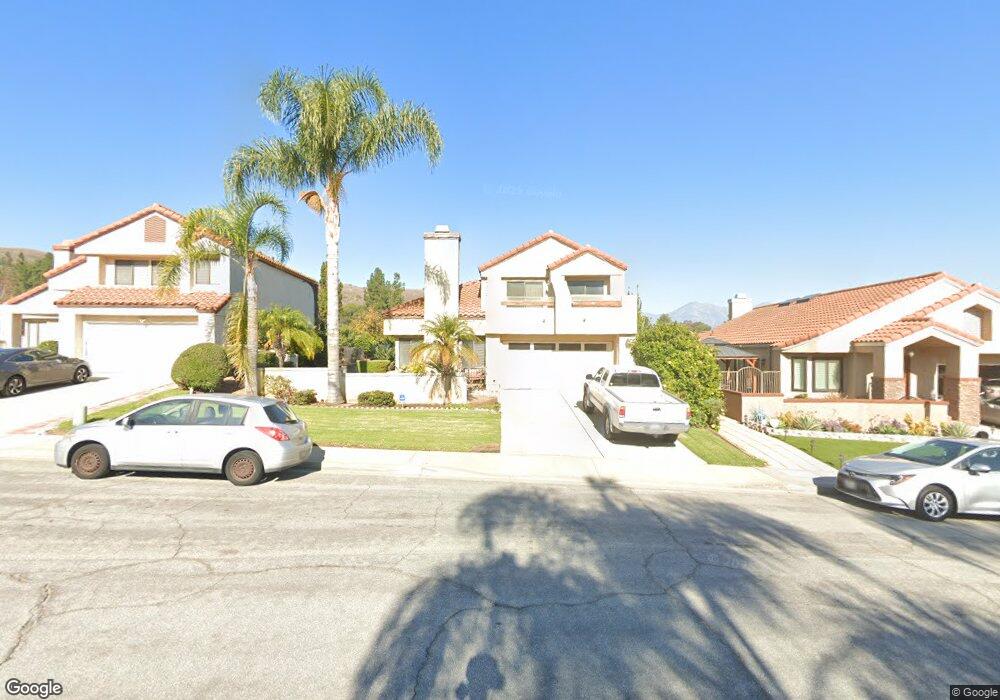
48 Chaparral Dr Pomona, CA 91766
Estimated Value: $847,700 - $902,000
3
Beds
3
Baths
1,787
Sq Ft
$493/Sq Ft
Est. Value
About This Home
This home is located at 48 Chaparral Dr, Pomona, CA 91766 and is currently estimated at $880,425, approximately $492 per square foot. 48 Chaparral Dr is a home located in Los Angeles County with nearby schools including Ranch Hills Elementary, Lorbeer Middle School, and Diamond Ranch High School.
Ownership History
Date
Name
Owned For
Owner Type
Purchase Details
Closed on
Mar 11, 2017
Sold by
Hope Judd Kelly and Hope Kelly
Bought by
Judd Richard and Hope Judd Kelly
Current Estimated Value
Home Financials for this Owner
Home Financials are based on the most recent Mortgage that was taken out on this home.
Original Mortgage
$355,000
Outstanding Balance
$294,385
Interest Rate
4.17%
Mortgage Type
New Conventional
Estimated Equity
$586,040
Purchase Details
Closed on
Jan 14, 2001
Sold by
Epperson Brian Craig and Epperson Kelly
Bought by
Hope Kelly
Home Financials for this Owner
Home Financials are based on the most recent Mortgage that was taken out on this home.
Original Mortgage
$189,000
Interest Rate
6.28%
Purchase Details
Closed on
Aug 9, 1996
Sold by
Biedermann John Edward and Biedermann Sandy Mayumi
Bought by
Epperson Brian and Apperson Kelly
Home Financials for this Owner
Home Financials are based on the most recent Mortgage that was taken out on this home.
Original Mortgage
$172,650
Interest Rate
8.23%
Create a Home Valuation Report for This Property
The Home Valuation Report is an in-depth analysis detailing your home's value as well as a comparison with similar homes in the area
Home Values in the Area
Average Home Value in this Area
Purchase History
| Date | Buyer | Sale Price | Title Company |
|---|---|---|---|
| Judd Richard | -- | Lawyers Title | |
| Hope Kelly | -- | United Title Company | |
| Epperson Brian | -- | Fidelity National Title Ins |
Source: Public Records
Mortgage History
| Date | Status | Borrower | Loan Amount |
|---|---|---|---|
| Open | Judd Richard | $355,000 | |
| Previous Owner | Hope Kelly | $189,000 | |
| Previous Owner | Epperson Brian | $172,650 |
Source: Public Records
Tax History Compared to Growth
Tax History
| Year | Tax Paid | Tax Assessment Tax Assessment Total Assessment is a certain percentage of the fair market value that is determined by local assessors to be the total taxable value of land and additions on the property. | Land | Improvement |
|---|---|---|---|---|
| 2025 | $4,088 | $296,071 | $87,936 | $208,135 |
| 2024 | $4,088 | $290,266 | $86,212 | $204,054 |
| 2023 | $4,011 | $284,575 | $84,522 | $200,053 |
| 2022 | $3,949 | $278,996 | $82,865 | $196,131 |
| 2021 | $3,858 | $273,527 | $81,241 | $192,286 |
| 2019 | $3,930 | $265,416 | $78,832 | $186,584 |
| 2018 | $3,661 | $260,213 | $77,287 | $182,926 |
| 2016 | $3,443 | $250,111 | $74,287 | $175,824 |
| 2015 | $3,415 | $246,355 | $73,172 | $173,183 |
| 2014 | $3,396 | $241,530 | $71,739 | $169,791 |
Source: Public Records
Map
Nearby Homes
- 49 Stagecoach Dr
- 18 Calle Del Rodeo
- 1 Country Wood Dr
- 15 Ravencrest Cir
- 35 Old Wood Rd
- 30 Country Wood Dr
- 23 Country Ridge Rd
- 25 Franciscan Place
- 46 Country Wood Dr
- 55 Los Coyotes Dr
- 15 Greensboro Ct
- 32 Franciscan Place
- 51 Rolling Hills Dr
- 8 Vista Ct
- 760 Featherwood Dr
- 54 Falcon Ridge Dr
- 19 Viewpoint Cir
- 6 Hunter Point Rd
- 26 Viewpoint Cir
- 24161 High Knob Rd
- 46 Chaparral Dr
- 50 Chaparral Dr
- 55 Silverwood Ln
- 44 Chaparral Dr
- 57 Silverwood Ln
- 53 Silverwood Ln
- 52 Chaparral Dr
- 59 Silverwood Ln
- 51 Silverwood Ln
- 43 Chaparral Dr
- 42 Chaparral Dr
- 45 Chaparral Dr
- 61 Silverwood Ln
- 41 Chaparral Dr
- 49 Silverwood Ln
- 63 Silverwood Ln
- 40 Chaparral Dr
- 39 Chaparral Dr
- 47 Silverwood Ln
- 65 Silverwood Ln