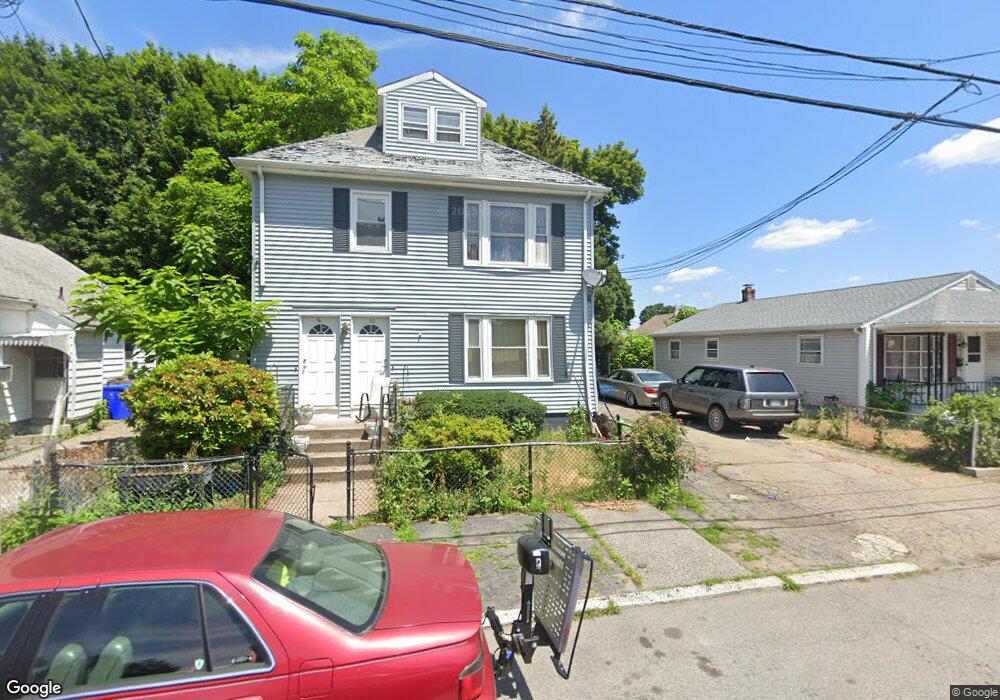
48 Chaplin St Pawtucket, RI 02861
Darlington NeighborhoodEstimated Value: $415,919 - $533,000
5
Beds
2
Baths
1,768
Sq Ft
$277/Sq Ft
Est. Value
About This Home
This home is located at 48 Chaplin St, Pawtucket, RI 02861 and is currently estimated at $490,480, approximately $277 per square foot. 48 Chaplin St is a home located in Providence County with nearby schools including St Cecilia School and Saint Raphael Academy.
Ownership History
Date
Name
Owned For
Owner Type
Purchase Details
Closed on
Mar 24, 2006
Sold by
Machala Donna L
Bought by
Ankoma Frank and Ankoma Angela B
Current Estimated Value
Home Financials for this Owner
Home Financials are based on the most recent Mortgage that was taken out on this home.
Original Mortgage
$214,000
Interest Rate
6.28%
Mortgage Type
Purchase Money Mortgage
Create a Home Valuation Report for This Property
The Home Valuation Report is an in-depth analysis detailing your home's value as well as a comparison with similar homes in the area
Home Values in the Area
Average Home Value in this Area
Purchase History
| Date | Buyer | Sale Price | Title Company |
|---|---|---|---|
| Ankoma Frank | $267,500 | -- |
Source: Public Records
Mortgage History
| Date | Status | Borrower | Loan Amount |
|---|---|---|---|
| Open | Ankoma Frank | $288,000 | |
| Closed | Ankoma Frank | $214,000 | |
| Closed | Ankoma Frank | $53,500 | |
| Previous Owner | Ankoma Frank | $92,000 |
Source: Public Records
Tax History
| Year | Tax Paid | Tax Assessment Tax Assessment Total Assessment is a certain percentage of the fair market value that is determined by local assessors to be the total taxable value of land and additions on the property. | Land | Improvement |
|---|---|---|---|---|
| 2025 | $4,922 | $374,300 | $120,100 | $254,200 |
| 2024 | $4,619 | $374,300 | $120,100 | $254,200 |
| 2023 | $4,311 | $254,500 | $75,100 | $179,400 |
| 2022 | $4,220 | $254,500 | $75,100 | $179,400 |
| 2021 | $4,220 | $254,500 | $75,100 | $179,400 |
| 2020 | $3,714 | $177,800 | $59,300 | $118,500 |
| 2019 | $3,714 | $177,800 | $59,300 | $118,500 |
| 2018 | $3,579 | $177,800 | $59,300 | $118,500 |
| 2017 | $3,206 | $141,100 | $47,800 | $93,300 |
| 2016 | $3,089 | $141,100 | $47,800 | $93,300 |
| 2015 | $3,089 | $141,100 | $47,800 | $93,300 |
| 2014 | $3,157 | $136,900 | $47,800 | $89,100 |
Source: Public Records
Map
Nearby Homes
Your Personal Tour Guide
Ask me questions while you tour the home.