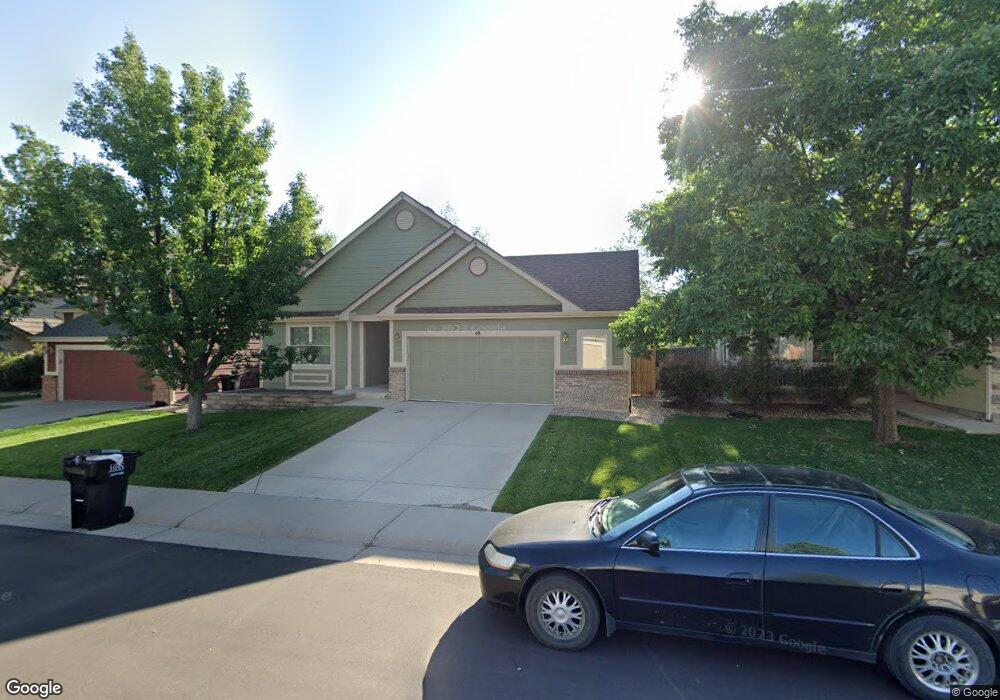
48 Cherry St Castle Rock, CO 80104
Founders Village NeighborhoodEstimated Value: $517,000 - $554,000
3
Beds
2
Baths
1,487
Sq Ft
$359/Sq Ft
Est. Value
About This Home
This home is located at 48 Cherry St, Castle Rock, CO 80104 and is currently estimated at $533,628, approximately $358 per square foot. 48 Cherry St is a home located in Douglas County with nearby schools including Rock Ridge Elementary School, Mesa Middle School, and Douglas County High School.
Ownership History
Date
Name
Owned For
Owner Type
Purchase Details
Closed on
Oct 16, 2015
Sold by
Thrush Grayson S and Thrush Karen
Bought by
Jacobs Karen
Current Estimated Value
Purchase Details
Closed on
Mar 26, 2008
Sold by
Jacobs Karen and Thrush Karen
Bought by
Thrush Karen and Thrush Grayson
Purchase Details
Closed on
Jun 8, 2001
Sold by
Bowden Rodney H and Bowden Emily S
Bought by
Jacobs Karen
Home Financials for this Owner
Home Financials are based on the most recent Mortgage that was taken out on this home.
Original Mortgage
$150,000
Interest Rate
6%
Purchase Details
Closed on
Sep 29, 1999
Sold by
Engle Homes Colorado Inc
Bought by
Bowden Rodney H and Bowden Emily S
Home Financials for this Owner
Home Financials are based on the most recent Mortgage that was taken out on this home.
Original Mortgage
$151,200
Interest Rate
7.25%
Purchase Details
Closed on
May 29, 1998
Sold by
Sunborne Ten Co
Bought by
Engle Homes Colo Inc
Purchase Details
Closed on
Aug 1, 1994
Sold by
Sandburst Inc
Bought by
Ash Kenneth E
Create a Home Valuation Report for This Property
The Home Valuation Report is an in-depth analysis detailing your home's value as well as a comparison with similar homes in the area
Home Values in the Area
Average Home Value in this Area
Purchase History
| Date | Buyer | Sale Price | Title Company |
|---|---|---|---|
| Jacobs Karen | -- | None Available | |
| Thrush Karen | -- | None Available | |
| Jacobs Karen | $207,000 | Land Title | |
| Bowden Rodney H | $159,200 | Universal Land Title | |
| Engle Homes Colo Inc | $284,200 | -- | |
| Ash Kenneth E | $366,000 | -- |
Source: Public Records
Mortgage History
| Date | Status | Borrower | Loan Amount |
|---|---|---|---|
| Previous Owner | Jacobs Karen | $150,000 | |
| Previous Owner | Bowden Rodney H | $151,200 |
Source: Public Records
Tax History Compared to Growth
Tax History
| Year | Tax Paid | Tax Assessment Tax Assessment Total Assessment is a certain percentage of the fair market value that is determined by local assessors to be the total taxable value of land and additions on the property. | Land | Improvement |
|---|---|---|---|---|
| 2025 | $5,628 | $34,350 | $8,820 | $25,530 |
| 2024 | $5,628 | $37,950 | $8,190 | $29,760 |
| 2023 | $5,661 | $37,950 | $8,190 | $29,760 |
| 2022 | $4,280 | $27,030 | $6,060 | $20,970 |
| 2021 | $4,360 | $27,030 | $6,060 | $20,970 |
| 2020 | $4,058 | $25,900 | $5,120 | $20,780 |
| 2019 | $4,060 | $25,900 | $5,120 | $20,780 |
| 2018 | $3,630 | $22,980 | $3,960 | $19,020 |
| 2017 | $3,494 | $22,980 | $3,960 | $19,020 |
| 2016 | $2,877 | $19,760 | $3,870 | $15,890 |
| 2015 | $1,457 | $19,760 | $3,870 | $15,890 |
| 2014 | $1,267 | $16,500 | $3,420 | $13,080 |
Source: Public Records
Map
Nearby Homes
- 5341 E Aspen Ave
- 5323 E Sandpiper Ave
- 109 N Quicksilver Ave
- 157 S Quicksilver Ave
- 5760 E Caley Ln
- 5326 E Howe St
- 207 S Quicksilver Ave
- 412 High Plains St
- 162 S Tilbury St
- 160 S Amherst St
- 5282 Devon Ave
- 5617 E Prescott Ave
- 5181 Devon Ave
- 535 Howe St
- 5864 Turnstone Place
- 469 Whisper Wind Ln
- 650 Howe Cir
- 512 Blue Teal Dr
- 6436 Vista Cliff Loop
- 475 Hampstead Ave