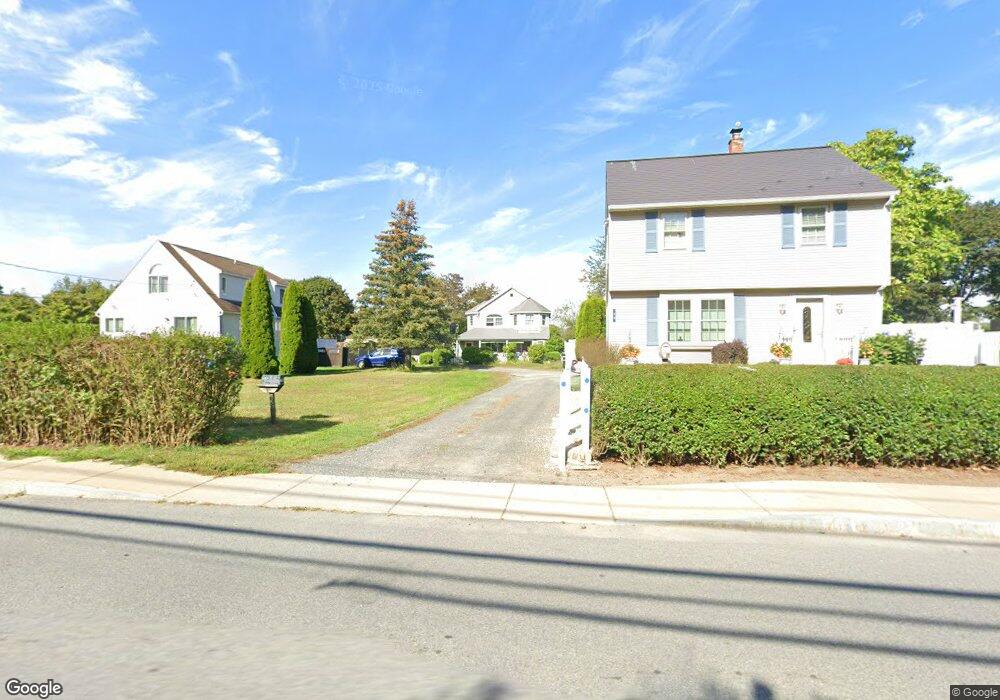
48 Cherry St Gloucester, MA 01930
Estimated Value: $473,000 - $824,000
3
Beds
2
Baths
1,702
Sq Ft
$388/Sq Ft
Est. Value
About This Home
This home is located at 48 Cherry St, Gloucester, MA 01930 and is currently estimated at $660,255, approximately $387 per square foot. 48 Cherry St is a home located in Essex County with nearby schools including Beeman Memorial, Ralph B O'maley Middle School, and Gloucester High School.
Ownership History
Date
Name
Owned For
Owner Type
Purchase Details
Closed on
Oct 22, 2020
Sold by
48 Cherry Street T
Bought by
Curran Ft
Current Estimated Value
Purchase Details
Closed on
May 3, 1995
Sold by
Brighside Ave T
Bought by
Curran James M and Curran Joan
Purchase Details
Closed on
May 12, 1988
Sold by
Jr Tr J G Bragg
Bought by
Brightside Ave Tr
Home Financials for this Owner
Home Financials are based on the most recent Mortgage that was taken out on this home.
Original Mortgage
$112,000
Interest Rate
10.02%
Mortgage Type
Purchase Money Mortgage
Create a Home Valuation Report for This Property
The Home Valuation Report is an in-depth analysis detailing your home's value as well as a comparison with similar homes in the area
Purchase History
| Date | Buyer | Sale Price | Title Company |
|---|---|---|---|
| Curran Ft | -- | None Available | |
| Curran James M | $56,000 | -- | |
| Brightside Ave Tr | $112,000 | -- |
Source: Public Records
Mortgage History
| Date | Status | Borrower | Loan Amount |
|---|---|---|---|
| Previous Owner | Brightside Ave Tr | $112,000 | |
| Previous Owner | Brightside Ave Tr | $20,000 |
Source: Public Records
Tax History
| Year | Tax Paid | Tax Assessment Tax Assessment Total Assessment is a certain percentage of the fair market value that is determined by local assessors to be the total taxable value of land and additions on the property. | Land | Improvement |
|---|---|---|---|---|
| 2025 | $5,662 | $582,500 | $196,800 | $385,700 |
| 2024 | $5,576 | $573,100 | $187,400 | $385,700 |
| 2023 | $5,341 | $504,300 | $167,400 | $336,900 |
| 2022 | $5,168 | $440,600 | $145,600 | $295,000 |
| 2021 | $4,986 | $400,800 | $132,300 | $268,500 |
| 2020 | $4,909 | $398,100 | $132,300 | $265,800 |
| 2019 | $4,685 | $369,200 | $132,300 | $236,900 |
| 2018 | $4,505 | $348,400 | $132,300 | $216,100 |
| 2017 | $4,365 | $330,900 | $126,000 | $204,900 |
| 2016 | $4,275 | $314,100 | $131,400 | $182,700 |
| 2015 | $4,096 | $300,100 | $131,400 | $168,700 |
Source: Public Records
Map
Nearby Homes
- 31 Echo Ave
- 13 Mystic Ave
- 3 Deacon Farm Ln
- 8 Mystic Ave
- 6 Monroe Ct
- 98 Maplewood Ave
- 9 Cleveland Place
- 12 Arthur St
- 13 Honeysuckle Rd
- 40 Sargent St
- 19 Trask St Unit 2
- 33 Maplewood Ave Unit 310
- 50 Warner St
- 113 Pleasant St
- 15 Harvard St
- 20 Beacon St
- 20 Beacon St Unit 2
- 20 Beacon St Unit 1
- 15 Mount Vernon St
- 2 Breezy Point Rd
Your Personal Tour Guide
Ask me questions while you tour the home.