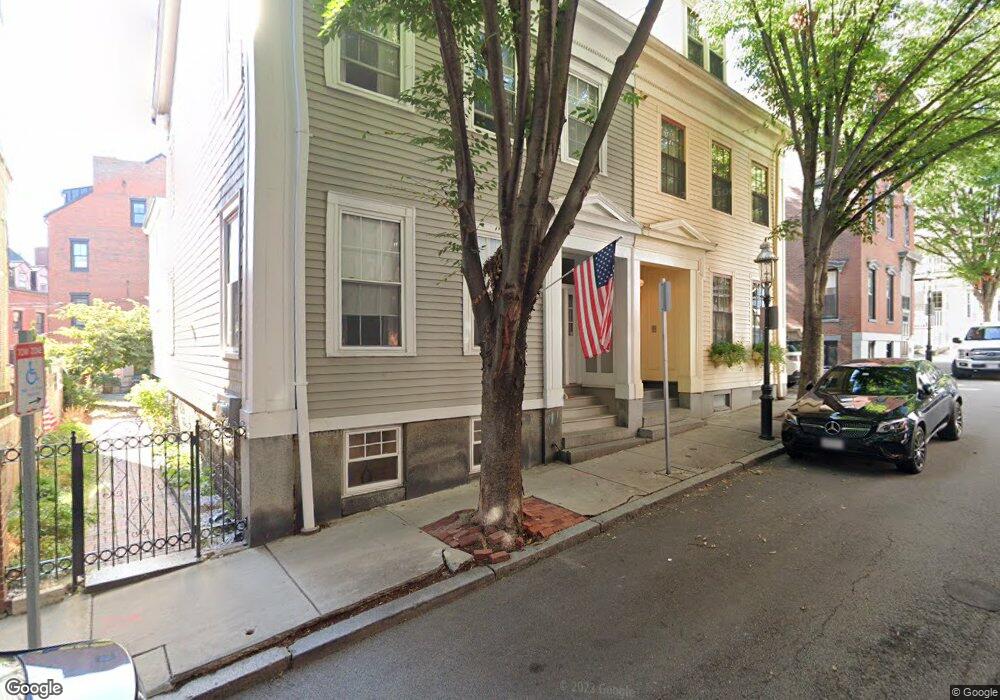
48 Chestnut St Charlestown, MA 02129
Thompson Square-Bunker Hill NeighborhoodEstimated Value: $1,700,702 - $2,569,000
4
Beds
4
Baths
3,480
Sq Ft
$563/Sq Ft
Est. Value
About This Home
This home is located at 48 Chestnut St, Charlestown, MA 02129 and is currently estimated at $1,960,176, approximately $563 per square foot. 48 Chestnut St is a home located in Suffolk County with nearby schools including Boston Children's School and St John School.
Ownership History
Date
Name
Owned For
Owner Type
Purchase Details
Closed on
Oct 26, 1990
Sold by
Ebs Rt
Bought by
Mcgee John D
Current Estimated Value
Purchase Details
Closed on
Aug 7, 1989
Sold by
Connolly James E
Bought by
Ebs Rt
Create a Home Valuation Report for This Property
The Home Valuation Report is an in-depth analysis detailing your home's value as well as a comparison with similar homes in the area
Home Values in the Area
Average Home Value in this Area
Purchase History
| Date | Buyer | Sale Price | Title Company |
|---|---|---|---|
| Mcgee John D | $402,500 | -- | |
| Ebs Rt | $350,000 | -- |
Source: Public Records
Mortgage History
| Date | Status | Borrower | Loan Amount |
|---|---|---|---|
| Open | Ebs Rt | $50,000 | |
| Open | Ebs Rt | $900,000 | |
| Closed | Ebs Rt | $390,000 |
Source: Public Records
Tax History Compared to Growth
Tax History
| Year | Tax Paid | Tax Assessment Tax Assessment Total Assessment is a certain percentage of the fair market value that is determined by local assessors to be the total taxable value of land and additions on the property. | Land | Improvement |
|---|---|---|---|---|
| 2025 | $22,692 | $1,959,600 | $857,400 | $1,102,200 |
| 2024 | $19,811 | $1,817,500 | $738,700 | $1,078,800 |
| 2023 | $18,592 | $1,731,100 | $703,600 | $1,027,500 |
| 2022 | $17,604 | $1,618,000 | $657,700 | $960,300 |
| 2021 | $16,762 | $1,570,900 | $638,500 | $932,400 |
| 2020 | $15,417 | $1,459,900 | $627,400 | $832,500 |
| 2019 | $13,983 | $1,326,700 | $473,800 | $852,900 |
| 2018 | $13,239 | $1,263,300 | $473,800 | $789,500 |
| 2017 | $12,741 | $1,203,100 | $473,800 | $729,300 |
| 2016 | $12,034 | $1,094,000 | $473,800 | $620,200 |
| 2015 | $10,383 | $857,400 | $362,200 | $495,200 |
| 2014 | $9,703 | $771,300 | $362,200 | $409,100 |
Source: Public Records
Map
Nearby Homes
- 12 Prospect St Unit 2
- 12 Prospect St Unit 1
- 5 Wallace Ct
- 73 Chelsea St Unit 401
- 106 Bunker Hill St Unit 2
- 106 Bunker Hill St Unit 6
- 106 Bunker Hill St Unit 1
- 106 Bunker Hill St Unit 4P
- 106 Bunker Hill St Unit 3
- 17 Henley St Unit F
- 17 Henley St Unit B
- 46 High St
- 172 Bunker Hill St Unit 1
- 56 High St Unit 3
- 22 Harvard St
- 42 8th St Unit 5316
- 42 8th St Unit 4209
- 42 8th St Unit 4106
- 42 8th St Unit 1201
- 42 8th St Unit 3306
- 46 Chestnut St
- 46 Chestnut St Unit 1
- 50 Chestnut St
- 54 Chestnut St Unit A
- 54 Chestnut St Unit 3
- 54 Chestnut St Unit 2
- 54 Chestnut St Unit 1
- 54 Chestnut St
- 44 Chestnut St Unit 3
- 44 Chestnut St Unit 2
- 44 Chestnut St Unit 1
- 44 Chestnut St Unit 6
- 4 Wallace Ct Unit 3
- 4 Wallace Ct Unit 2
- 4 Wallace Ct Unit 1
- 42 Chestnut St
- 3 Wallace Ct
- 49 Chestnut St
- 43 Chestnut St Unit 2
- 43 Chestnut St Unit 3