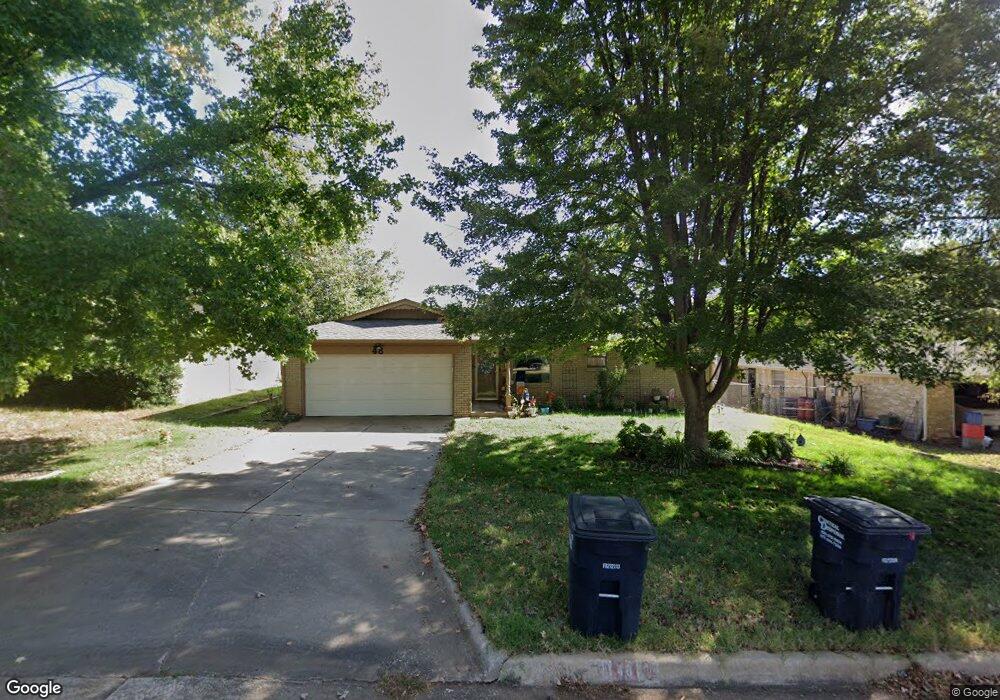
48 Chickasaw Dr Shawnee, OK 74801
Estimated Value: $158,130 - $184,000
3
Beds
2
Baths
1,236
Sq Ft
$139/Sq Ft
Est. Value
About This Home
This home is located at 48 Chickasaw Dr, Shawnee, OK 74801 and is currently estimated at $171,533, approximately $138 per square foot. 48 Chickasaw Dr is a home located in Pottawatomie County with nearby schools including Sequoyah Elementary School, Shawnee Middle School, and Shawnee High School.
Ownership History
Date
Name
Owned For
Owner Type
Purchase Details
Closed on
May 27, 2005
Sold by
Garrett Stephanie and Garrett Clint
Bought by
Turner Beverly A
Current Estimated Value
Home Financials for this Owner
Home Financials are based on the most recent Mortgage that was taken out on this home.
Original Mortgage
$81,357
Outstanding Balance
$41,846
Interest Rate
5.83%
Mortgage Type
FHA
Estimated Equity
$129,687
Purchase Details
Closed on
Mar 29, 2002
Sold by
Newton Daniel and Newton Julie
Bought by
Garrett Stephanie
Purchase Details
Closed on
Oct 18, 2000
Sold by
Rackley Renee Alaen
Bought by
Newton Daniel and Newton Julie
Purchase Details
Closed on
Apr 8, 1998
Sold by
Rogers Lloyd and Rogers Vergeanne
Bought by
Culbreath Renee and Culbreath Christo
Purchase Details
Closed on
Nov 13, 1996
Sold by
Jackson Jackson J and Jackson D
Bought by
Rogers Lloyd and Rogers Vergeanne
Purchase Details
Closed on
Aug 27, 1993
Sold by
Shults Larry and Shults
Bought by
Jackson Jackson J and Jackson D
Create a Home Valuation Report for This Property
The Home Valuation Report is an in-depth analysis detailing your home's value as well as a comparison with similar homes in the area
Purchase History
| Date | Buyer | Sale Price | Title Company |
|---|---|---|---|
| Turner Beverly A | $82,000 | None Available | |
| Garrett Stephanie | $78,500 | -- | |
| Newton Daniel | $66,500 | -- | |
| Culbreath Renee | $68,000 | -- | |
| Rogers Lloyd | $62,000 | -- | |
| Jackson Jackson J | $56,000 | -- |
Source: Public Records
Mortgage History
| Date | Status | Borrower | Loan Amount |
|---|---|---|---|
| Open | Turner Beverly A | $81,357 |
Source: Public Records
Tax History
| Year | Tax Paid | Tax Assessment Tax Assessment Total Assessment is a certain percentage of the fair market value that is determined by local assessors to be the total taxable value of land and additions on the property. | Land | Improvement |
|---|---|---|---|---|
| 2025 | $1,040 | $11,427 | $650 | $10,777 |
| 2024 | $1,021 | $11,094 | $650 | $10,444 |
| 2023 | $1,021 | $10,772 | $792 | $9,980 |
| 2022 | $1,003 | $10,772 | $792 | $9,980 |
| 2021 | $985 | $10,772 | $792 | $9,980 |
| 2020 | $1,020 | $11,094 | $792 | $10,302 |
| 2019 | $1,071 | $11,255 | $792 | $10,463 |
| 2018 | $1,057 | $11,326 | $775 | $10,551 |
| 2017 | $1,009 | $10,996 | $742 | $10,254 |
| 2016 | $987 | $10,676 | $710 | $9,966 |
| 2015 | $937 | $10,366 | $708 | $9,658 |
| 2014 | $906 | $10,063 | $661 | $9,402 |
Source: Public Records
Map
Nearby Homes
- 17 Mojave Dr
- 1262 Augusta Ct
- 0 Robinwood Place
- 1181 Augusta Ct
- 32 Comanche Dr
- 17 Sequoyah Blvd
- 24 Seneca Dr
- 31 Seneca Dr
- 2310 Lakeside Cir
- 1307 Laverne Ave
- 703 N Roosevelt Ave
- 648 N Cleveland Ave
- 1404 Charles Dr
- 1213 Muirfield Dr
- 2500 E Highland St
- 1506 Windmill Ridge Dr
- 1306 E Wallace St
- 911 N Pesotum Ave
- 9 Dustin Cir
- 1327 E Fay St
Your Personal Tour Guide
Ask me questions while you tour the home.