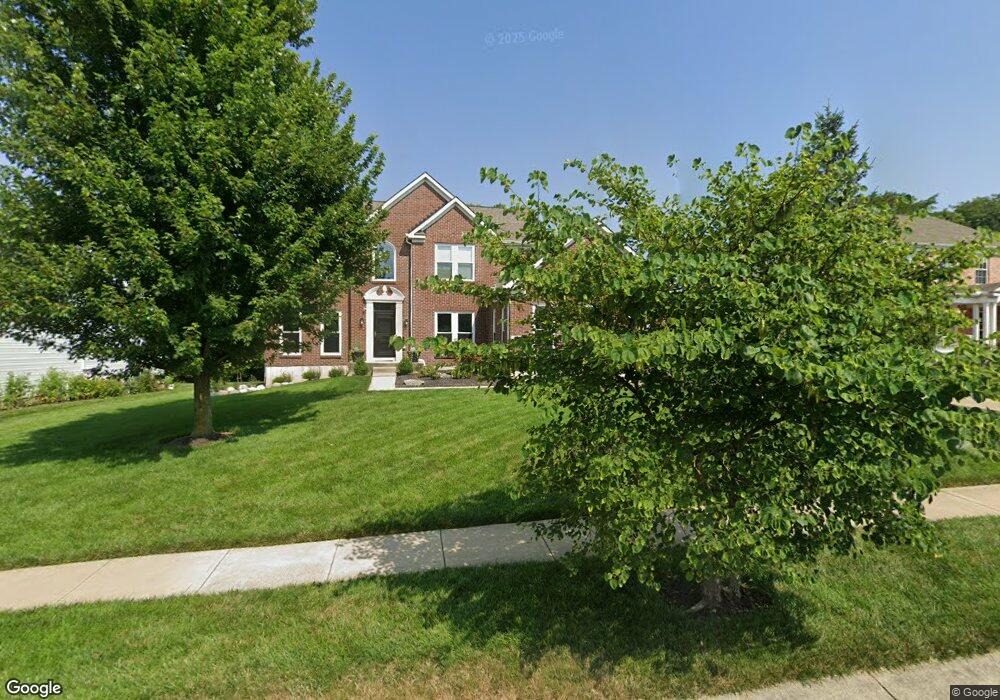
48 Clevenger Ct Springboro, OH 45066
Estimated Value: $570,043 - $710,000
4
Beds
4
Baths
4,024
Sq Ft
$152/Sq Ft
Est. Value
About This Home
This home is located at 48 Clevenger Ct, Springboro, OH 45066 and is currently estimated at $612,511, approximately $152 per square foot. 48 Clevenger Ct is a home located in Warren County with nearby schools including Clearcreek Elementary School, Dennis Elementary School, and Springboro Intermediate School.
Ownership History
Date
Name
Owned For
Owner Type
Purchase Details
Closed on
Jun 22, 2017
Sold by
Barker Brian C and Barker Mary Beth
Bought by
Ortiz Enrique and Ortiz Stacy L
Current Estimated Value
Home Financials for this Owner
Home Financials are based on the most recent Mortgage that was taken out on this home.
Original Mortgage
$286,400
Outstanding Balance
$237,767
Interest Rate
3.95%
Mortgage Type
New Conventional
Estimated Equity
$374,744
Purchase Details
Closed on
Jan 18, 2006
Sold by
Nvr Inc
Bought by
Barker Brian C and Barker Mary Beth
Home Financials for this Owner
Home Financials are based on the most recent Mortgage that was taken out on this home.
Original Mortgage
$267,800
Interest Rate
6%
Mortgage Type
Purchase Money Mortgage
Purchase Details
Closed on
Oct 12, 2005
Sold by
Hdc Iv Llc
Bought by
Nvr Inc
Create a Home Valuation Report for This Property
The Home Valuation Report is an in-depth analysis detailing your home's value as well as a comparison with similar homes in the area
Home Values in the Area
Average Home Value in this Area
Purchase History
| Date | Buyer | Sale Price | Title Company |
|---|---|---|---|
| Ortiz Enrique | $358,000 | Republic Title Agency | |
| Barker Brian C | $334,833 | First Title | |
| Nvr Inc | $46,200 | First Title |
Source: Public Records
Mortgage History
| Date | Status | Borrower | Loan Amount |
|---|---|---|---|
| Open | Ortiz Enrique | $286,400 | |
| Closed | Barker Brian C | $267,800 |
Source: Public Records
Tax History Compared to Growth
Tax History
| Year | Tax Paid | Tax Assessment Tax Assessment Total Assessment is a certain percentage of the fair market value that is determined by local assessors to be the total taxable value of land and additions on the property. | Land | Improvement |
|---|---|---|---|---|
| 2024 | $6,256 | $160,200 | $35,000 | $125,200 |
| 2023 | $5,451 | $128,002 | $17,220 | $110,782 |
| 2022 | $5,370 | $128,002 | $17,220 | $110,782 |
| 2021 | $4,998 | $128,002 | $17,220 | $110,782 |
| 2020 | $4,648 | $104,066 | $14,000 | $90,066 |
| 2019 | $4,286 | $104,066 | $14,000 | $90,066 |
| 2018 | $4,289 | $104,066 | $14,000 | $90,066 |
| 2017 | $4,113 | $89,894 | $12,436 | $77,459 |
| 2016 | $4,290 | $89,894 | $12,436 | $77,459 |
| 2015 | $4,125 | $89,894 | $12,436 | $77,459 |
| 2014 | $4,125 | $81,720 | $11,310 | $70,420 |
| 2013 | $4,122 | $101,200 | $14,000 | $87,200 |
Source: Public Records
Map
Nearby Homes
- 6265 Red Lion 5 Points Rd
- 5944 Round Hill Ct
- 980 Heatherwoode Cir
- 8 Glasgow St Unit 30
- 8 Glasgow St
- 18 Glasgow St Unit 29
- 18 Glasgow St
- 25 Morris St
- 25 Morris St Unit 13
- 45 Morris St Unit 15
- 45 Morris St
- 70 Morris St Unit 6
- 65 Morris St Unit 17
- 65 Morris St
- Hampton Plan at Northampton
- Cheswicke Plan at Northampton
- Barrett Plan at Northampton
- Hyde Park Plan at Northampton
- Melville Plan at Northampton
- Cooke Plan at Northampton
- 54 Clevenger Ct
- 42 Clevenger Ct
- 60 Clevenger Ct
- 35 Clevenger Ct
- 25 Clevenger Ct
- 36 Clevenger Ct
- 45 Clevenger Ct
- 66 Clevenger Ct
- 55 Clevenger Ct
- 15 Clevenger Ct
- 30 Clevenger Ct
- 24 Clevenger Ct
- 72 Clevenger Ct
- 65 Clevenger Ct
- 410 Null Blvd
- 18 Clevenger Ct
- 450 Null Blvd
- 5 Clevenger Ct
- 75 Clevenger Ct
- 12 Clevenger Ct