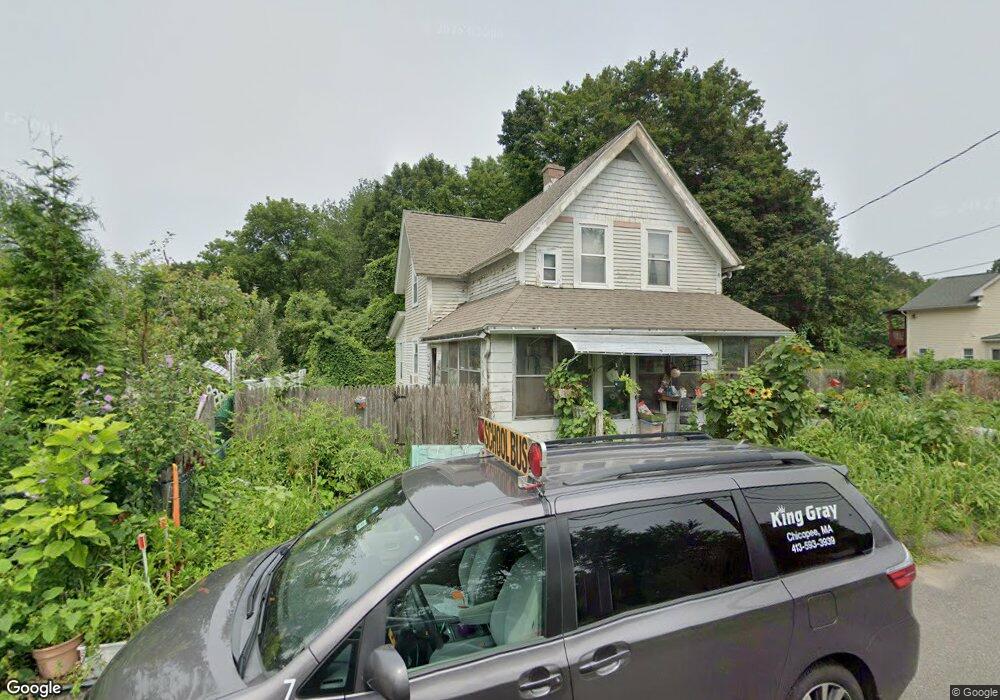
48 Cross St Ludlow, MA 01056
Estimated Value: $279,000 - $305,000
3
Beds
2
Baths
1,022
Sq Ft
$287/Sq Ft
Est. Value
About This Home
This home is located at 48 Cross St, Ludlow, MA 01056 and is currently estimated at $293,101, approximately $286 per square foot. 48 Cross St is a home located in Hampden County with nearby schools including East Street Elementary School, Chapin Street Elementary School, and Paul R. Baird Middle School.
Ownership History
Date
Name
Owned For
Owner Type
Purchase Details
Closed on
Feb 18, 2000
Sold by
Niedbala James and Niedbala Sharon
Bought by
Menches Francine and Guerra Frank
Current Estimated Value
Home Financials for this Owner
Home Financials are based on the most recent Mortgage that was taken out on this home.
Original Mortgage
$61,200
Outstanding Balance
$20,157
Interest Rate
8.11%
Mortgage Type
Purchase Money Mortgage
Estimated Equity
$272,944
Purchase Details
Closed on
May 28, 1999
Sold by
Casagrande Viola and Niedbala Sharon
Bought by
Niedbala James
Create a Home Valuation Report for This Property
The Home Valuation Report is an in-depth analysis detailing your home's value as well as a comparison with similar homes in the area
Home Values in the Area
Average Home Value in this Area
Purchase History
| Date | Buyer | Sale Price | Title Company |
|---|---|---|---|
| Menches Francine | $76,500 | -- | |
| Menches Francine | $76,500 | -- | |
| Niedbala James | $46,800 | -- | |
| Niedbala James | $46,800 | -- |
Source: Public Records
Mortgage History
| Date | Status | Borrower | Loan Amount |
|---|---|---|---|
| Open | Niedbala James | $61,200 | |
| Closed | Niedbala James | $61,200 |
Source: Public Records
Tax History Compared to Growth
Tax History
| Year | Tax Paid | Tax Assessment Tax Assessment Total Assessment is a certain percentage of the fair market value that is determined by local assessors to be the total taxable value of land and additions on the property. | Land | Improvement |
|---|---|---|---|---|
| 2025 | $3,583 | $206,500 | $83,500 | $123,000 |
| 2024 | $3,509 | $194,000 | $83,500 | $110,500 |
| 2023 | $3,364 | $172,400 | $76,500 | $95,900 |
| 2022 | $3,038 | $152,000 | $70,100 | $81,900 |
| 2021 | $3,073 | $145,800 | $70,100 | $75,700 |
| 2020 | $2,949 | $143,000 | $69,000 | $74,000 |
| 2019 | $2,745 | $138,500 | $68,400 | $70,100 |
| 2018 | $2,583 | $135,900 | $68,400 | $67,500 |
| 2017 | $2,481 | $133,900 | $67,000 | $66,900 |
| 2016 | $2,362 | $130,300 | $65,700 | $64,600 |
| 2015 | $2,218 | $128,300 | $65,000 | $63,300 |
Source: Public Records
Map
Nearby Homes
- 0 Fuller St Unit 73409741
- 70 Fuller St
- 84 Fuller St Unit 1
- 98 Fuller St Unit 32
- 32 White St
- 42 Loopley St
- 60 Loopley St
- 24 Elm St
- 0 Center St Unit 73415933
- 517 Ideal Ln Unit 401
- 87 Haviland St
- 298 Main St
- 295 Main St
- 0 Parker St (Ws) Unit 73388310
- 61 Massachusetts Ave
- 84 Chapin Greene Dr
- 287 East St
- 41 Orchard St
- 45 Meadow St
- 201 Main St