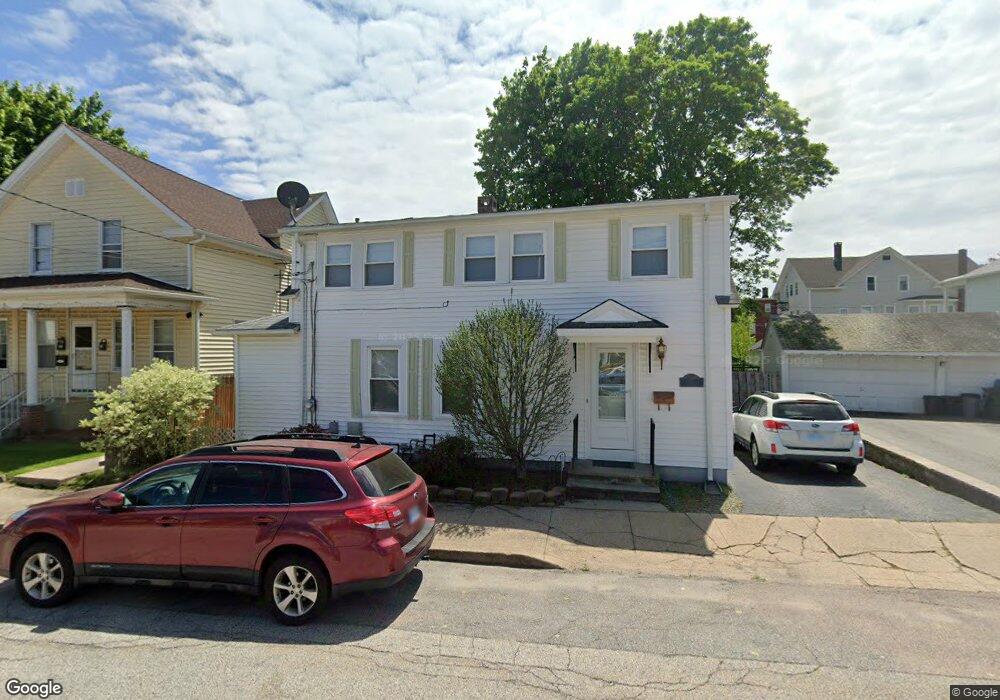
48 Curson St West Warwick, RI 02893
West Warwick Centre NeighborhoodEstimated Value: $371,300 - $402,000
3
Beds
2
Baths
1,546
Sq Ft
$252/Sq Ft
Est. Value
About This Home
This home is located at 48 Curson St, West Warwick, RI 02893 and is currently estimated at $390,075, approximately $252 per square foot. 48 Curson St is a home located in Kent County with nearby schools including West Warwick High School and Islamic School of Rhode Island.
Ownership History
Date
Name
Owned For
Owner Type
Purchase Details
Closed on
Apr 25, 2011
Sold by
Potvin Paul C
Bought by
Elliott 3Rd Eugene J
Current Estimated Value
Home Financials for this Owner
Home Financials are based on the most recent Mortgage that was taken out on this home.
Original Mortgage
$89,637
Outstanding Balance
$62,130
Interest Rate
4.9%
Mortgage Type
Purchase Money Mortgage
Estimated Equity
$327,945
Purchase Details
Closed on
Aug 12, 2004
Sold by
Coates Thomas F
Bought by
Potvin Paul C
Home Financials for this Owner
Home Financials are based on the most recent Mortgage that was taken out on this home.
Original Mortgage
$108,500
Interest Rate
6.16%
Mortgage Type
Purchase Money Mortgage
Purchase Details
Closed on
Aug 12, 1997
Sold by
Source One Mtg Service
Bought by
Housing & Urban Dev
Create a Home Valuation Report for This Property
The Home Valuation Report is an in-depth analysis detailing your home's value as well as a comparison with similar homes in the area
Home Values in the Area
Average Home Value in this Area
Purchase History
| Date | Buyer | Sale Price | Title Company |
|---|---|---|---|
| Elliott 3Rd Eugene J | $92,000 | -- | |
| Potvin Paul C | $160,000 | -- | |
| Housing & Urban Dev | $73,500 | -- |
Source: Public Records
Mortgage History
| Date | Status | Borrower | Loan Amount |
|---|---|---|---|
| Open | Housing & Urban Dev | $89,637 | |
| Closed | Housing & Urban Dev | $3,220 | |
| Closed | Housing & Urban Dev | $3,000 | |
| Previous Owner | Housing & Urban Dev | $108,500 |
Source: Public Records
Tax History Compared to Growth
Tax History
| Year | Tax Paid | Tax Assessment Tax Assessment Total Assessment is a certain percentage of the fair market value that is determined by local assessors to be the total taxable value of land and additions on the property. | Land | Improvement |
|---|---|---|---|---|
| 2025 | $4,347 | $304,200 | $74,700 | $229,500 |
| 2024 | $3,992 | $213,600 | $47,500 | $166,100 |
| 2023 | $3,913 | $213,600 | $47,500 | $166,100 |
| 2022 | $3,853 | $213,600 | $47,500 | $166,100 |
| 2021 | $3,811 | $165,700 | $39,000 | $126,700 |
| 2020 | $3,811 | $165,700 | $39,000 | $126,700 |
| 2019 | $4,858 | $165,700 | $39,000 | $126,700 |
| 2018 | $3,028 | $111,400 | $36,600 | $74,800 |
| 2017 | $2,931 | $111,400 | $36,600 | $74,800 |
| 2016 | $2,879 | $111,400 | $36,600 | $74,800 |
| 2015 | $2,757 | $106,200 | $36,600 | $69,600 |
| 2014 | $2,696 | $106,200 | $36,600 | $69,600 |
Source: Public Records
Map
Nearby Homes