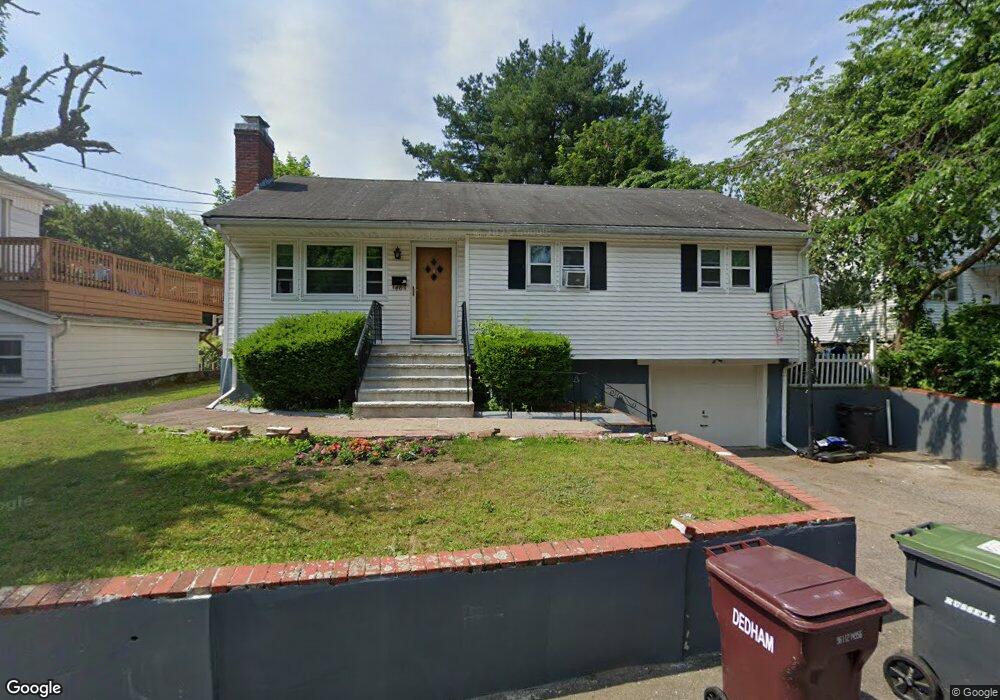
48 Curve St Dedham, MA 02026
East Dedham NeighborhoodEstimated Value: $588,000 - $642,000
3
Beds
2
Baths
1,105
Sq Ft
$548/Sq Ft
Est. Value
About This Home
This home is located at 48 Curve St, Dedham, MA 02026 and is currently estimated at $605,802, approximately $548 per square foot. 48 Curve St is a home located in Norfolk County with nearby schools including Avery, Dedham Middle School, and Dedham High School.
Ownership History
Date
Name
Owned For
Owner Type
Purchase Details
Closed on
Jul 26, 2021
Sold by
Georgeon Marie R and Letang Yves
Bought by
Georgeon Marie R and Georgeon Derrick K
Current Estimated Value
Home Financials for this Owner
Home Financials are based on the most recent Mortgage that was taken out on this home.
Original Mortgage
$347,069
Outstanding Balance
$306,219
Interest Rate
2.93%
Mortgage Type
FHA
Estimated Equity
$299,583
Purchase Details
Closed on
Aug 7, 2006
Sold by
Carlson Frances and Buttaro Vincent
Bought by
Georgeon Marie R and Letang Yves
Home Financials for this Owner
Home Financials are based on the most recent Mortgage that was taken out on this home.
Original Mortgage
$257,600
Interest Rate
6.7%
Mortgage Type
Purchase Money Mortgage
Create a Home Valuation Report for This Property
The Home Valuation Report is an in-depth analysis detailing your home's value as well as a comparison with similar homes in the area
Home Values in the Area
Average Home Value in this Area
Purchase History
| Date | Buyer | Sale Price | Title Company |
|---|---|---|---|
| Georgeon Marie R | -- | None Available | |
| Georgeon Marie R | -- | None Available | |
| Georgeon Marie R | $322,000 | -- | |
| Georgeon Marie R | $322,000 | -- |
Source: Public Records
Mortgage History
| Date | Status | Borrower | Loan Amount |
|---|---|---|---|
| Open | Georgeon Marie R | $347,069 | |
| Previous Owner | Georgeon Marie R | $257,600 | |
| Previous Owner | Georgeon Marie R | $64,400 |
Source: Public Records
Tax History
| Year | Tax Paid | Tax Assessment Tax Assessment Total Assessment is a certain percentage of the fair market value that is determined by local assessors to be the total taxable value of land and additions on the property. | Land | Improvement |
|---|---|---|---|---|
| 2025 | $6,218 | $492,700 | $249,900 | $242,800 |
| 2024 | $6,080 | $486,400 | $236,600 | $249,800 |
| 2023 | $5,680 | $442,400 | $210,100 | $232,300 |
| 2022 | $5,449 | $408,200 | $205,600 | $202,600 |
| 2021 | $5,318 | $389,000 | $201,200 | $187,800 |
| 2020 | $5,120 | $373,200 | $192,300 | $180,900 |
| 2019 | $4,920 | $347,700 | $167,300 | $180,400 |
| 2018 | $4,628 | $318,100 | $150,900 | $167,200 |
| 2017 | $4,552 | $308,400 | $141,200 | $167,200 |
| 2016 | $4,539 | $293,000 | $123,300 | $169,700 |
| 2015 | $4,164 | $262,400 | $112,800 | $149,600 |
| 2014 | $3,811 | $237,000 | $110,300 | $126,700 |
Source: Public Records
Map
Nearby Homes
- 4 Mount Hope St
- 153 Colburn St
- 49 Greenhood St
- 109 Rockland St
- 108 High St
- 90 High St Unit 309
- 30 High St ( Cass St Entrance) Unit 209
- 94 Rockland St
- 19 Lewis Ln
- 111 Schiller Rd
- 132 Whitehall St
- 25 Rockland St Unit 5
- 25R Rockland St Unit 6
- 8 Sumner St
- 73 Walnut St
- 56 Mount Vernon St
- 28 Linden Place
- 7 S Stone Mill Dr Unit 412
- 7 S Stone Mill Dr Unit 403
- 22 N Stone Mill Dr Unit 1111
- 42 Curve St
- 52 Curve St Unit 52
- 5 Waldo St Unit 2
- 50 Curve St
- 50 Curve St Unit 1
- 17 Waldo St
- 58 Curve St
- 49 Curve St
- 43 Curve St
- 39 Curve St
- 41 Curve St
- 37 Curve St
- 37 Curve St Unit 1
- 39 Curve St Unit 2
- 41 Curve St Unit 3
- 53 Curve St Unit 1
- 2 Mount Hope St Unit 2
- 32 Curve St
- 12 Gould St
- 4 Mount Hope St Unit 4
Your Personal Tour Guide
Ask me questions while you tour the home.