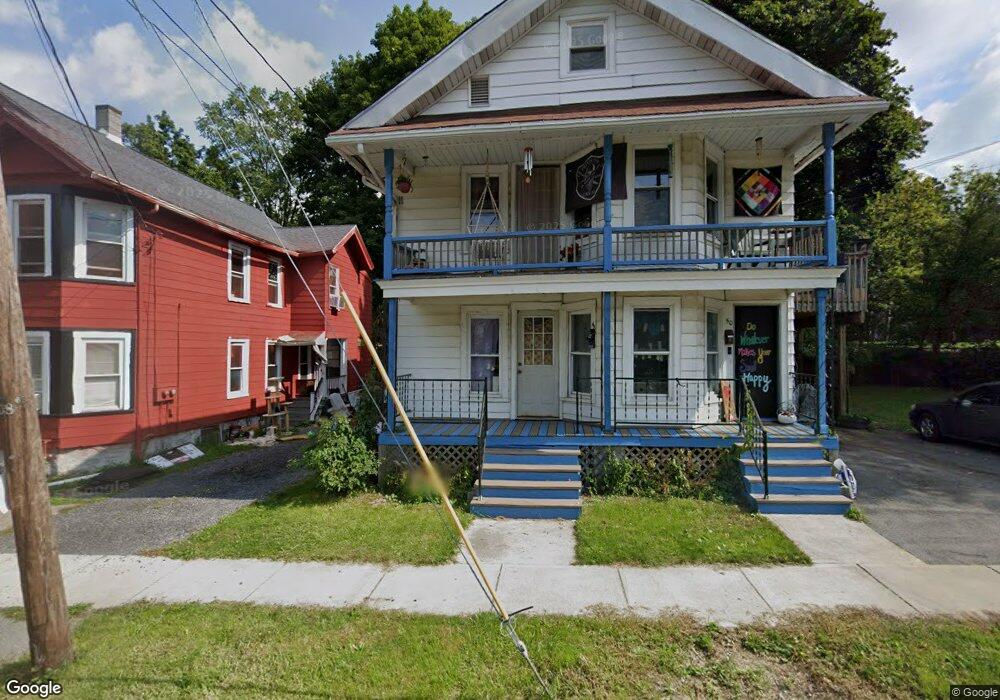
48 Delevan St Unit 50 Auburn, NY 13021
Estimated Value: $91,000 - $124,000
4
Beds
2
Baths
1,482
Sq Ft
$71/Sq Ft
Est. Value
About This Home
This home is located at 48 Delevan St Unit 50, Auburn, NY 13021 and is currently estimated at $104,667, approximately $70 per square foot. 48 Delevan St Unit 50 is a home located in Cayuga County with nearby schools including Auburn Junior High School, Auburn High School, and Creative Minds Montessori School.
Ownership History
Date
Name
Owned For
Owner Type
Purchase Details
Closed on
Sep 28, 2006
Sold by
Morehouse Kristen
Bought by
Leubner Edward
Current Estimated Value
Home Financials for this Owner
Home Financials are based on the most recent Mortgage that was taken out on this home.
Original Mortgage
$69,615
Outstanding Balance
$41,564
Interest Rate
6.47%
Mortgage Type
Credit Line Revolving
Estimated Equity
$63,103
Purchase Details
Closed on
Oct 8, 1997
Sold by
Shaw Ronald R
Bought by
Morehouse Kristen
Create a Home Valuation Report for This Property
The Home Valuation Report is an in-depth analysis detailing your home's value as well as a comparison with similar homes in the area
Home Values in the Area
Average Home Value in this Area
Purchase History
| Date | Buyer | Sale Price | Title Company |
|---|---|---|---|
| Leubner Edward | $45,000 | John Yuhas | |
| Morehouse Kristen | $47,000 | -- |
Source: Public Records
Mortgage History
| Date | Status | Borrower | Loan Amount |
|---|---|---|---|
| Open | Leubner Edward | $69,615 |
Source: Public Records
Tax History Compared to Growth
Tax History
| Year | Tax Paid | Tax Assessment Tax Assessment Total Assessment is a certain percentage of the fair market value that is determined by local assessors to be the total taxable value of land and additions on the property. | Land | Improvement |
|---|---|---|---|---|
| 2024 | $1,811 | $77,800 | $16,500 | $61,300 |
| 2023 | $1,812 | $77,800 | $16,500 | $61,300 |
| 2022 | $1,859 | $77,800 | $16,500 | $61,300 |
| 2021 | $1,762 | $64,300 | $7,500 | $56,800 |
| 2020 | $1,740 | $64,300 | $7,500 | $56,800 |
| 2019 | $544 | $64,300 | $7,500 | $56,800 |
| 2018 | $1,700 | $64,000 | $7,500 | $56,500 |
| 2017 | $1,721 | $62,900 | $7,900 | $55,000 |
| 2016 | $2,161 | $62,900 | $7,900 | $55,000 |
| 2015 | $969 | $62,900 | $7,900 | $55,000 |
| 2014 | $969 | $62,900 | $7,900 | $55,000 |
Source: Public Records
Map
Nearby Homes