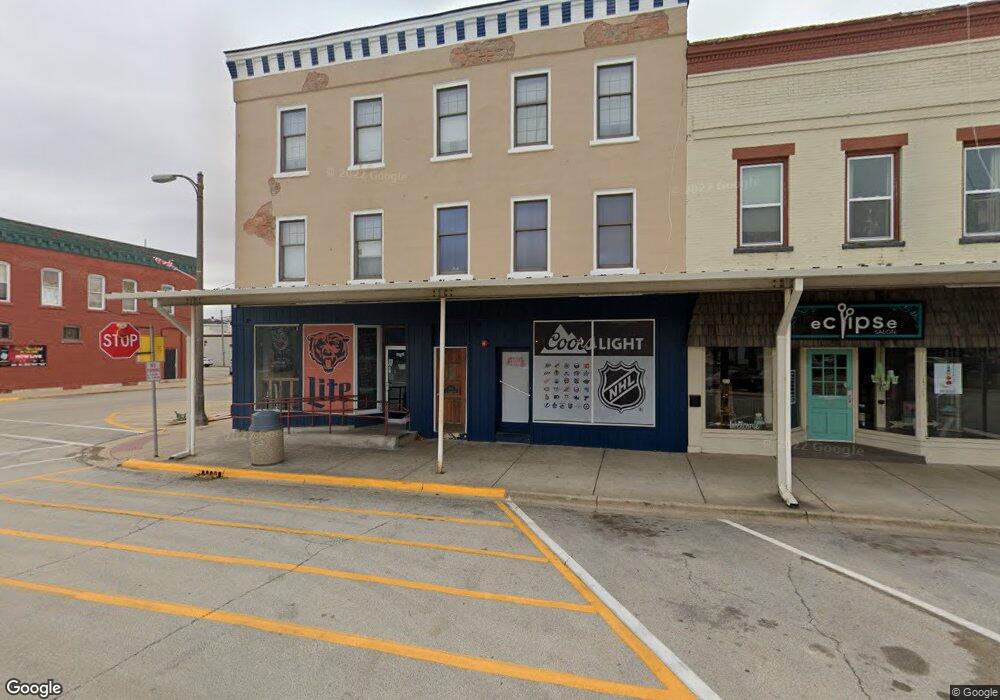
48 E Railroad St Sandwich, IL 60548
Studio
--
Bath
4,400
Sq Ft
--
Built
About This Home
This home is located at 48 E Railroad St, Sandwich, IL 60548. 48 E Railroad St is a home located in DeKalb County with nearby schools including Sandwich Community High School.
Create a Home Valuation Report for This Property
The Home Valuation Report is an in-depth analysis detailing your home's value as well as a comparison with similar homes in the area
Home Values in the Area
Average Home Value in this Area
Tax History
| Year | Tax Paid | Tax Assessment Tax Assessment Total Assessment is a certain percentage of the fair market value that is determined by local assessors to be the total taxable value of land and additions on the property. | Land | Improvement |
|---|---|---|---|---|
| 2025 | $8,603 | $123,380 | $20,629 | $102,751 |
| 2024 | $8,365 | $113,338 | $18,950 | $94,388 |
| 2023 | $8,365 | $100,924 | $16,874 | $84,050 |
| 2022 | $7,974 | $93,353 | $15,608 | $77,745 |
| 2021 | $7,771 | $89,069 | $14,892 | $74,177 |
| 2020 | $7,689 | $88,004 | $14,714 | $73,290 |
| 2019 | $7,739 | $85,044 | $14,219 | $70,825 |
| 2018 | $7,446 | $80,649 | $13,484 | $67,165 |
| 2017 | $7,212 | $76,394 | $12,773 | $63,621 |
| 2016 | $7,201 | $71,785 | $12,002 | $59,783 |
| 2015 | -- | $68,490 | $11,451 | $57,039 |
| 2014 | -- | $67,585 | $11,300 | $56,285 |
| 2013 | -- | $70,000 | $11,704 | $58,296 |
Source: Public Records
Map
Nearby Homes
- 322 E Church St
- 404 S Wolfe St
- 213 N Main St
- 421 E Church St
- 503 S Wells St
- 322 N Eddy St
- 309 E 3rd St
- 314 W Fayette St
- 421 De Kalb St
- 623 Lisbon St
- 1515 Cindy Ln
- 316 W Knights Rd
- 608 Bender St
- 1319 Nichole Ln
- 1104 Oak Bend Rd
- 1102 Oak Bend Rd
- 1106 Oak Bend Rd
- 1110 Oak Bend Rd
- 1113 Oak Bend Rd
- 1267 Red Fox Cir
- 8 E Railroad St Unit 7
- 8 E Railroad St Unit 2ERR
- 8 E Railroad St Unit 8
- 8 E Railroad St Unit 1
- 8 E Railroad St Unit 5
- 8 E Railroad St Unit 9
- 8 E Railroad St Unit 6
- 8 E Railroad St Unit 3
- 124 S Main St
- 28 E Railroad St
- 26 E Railroad St
- 128 S Main St
- 16 E Railroad St
- 36 E Railroad St
- 40 E Railroad St
- 18 E Railroad St Unit 1
- 18 E Railroad St Unit 3
- 20 E Railroad St
- 2 E Railroad St
- 30 E Railroad St
Your Personal Tour Guide
Ask me questions while you tour the home.