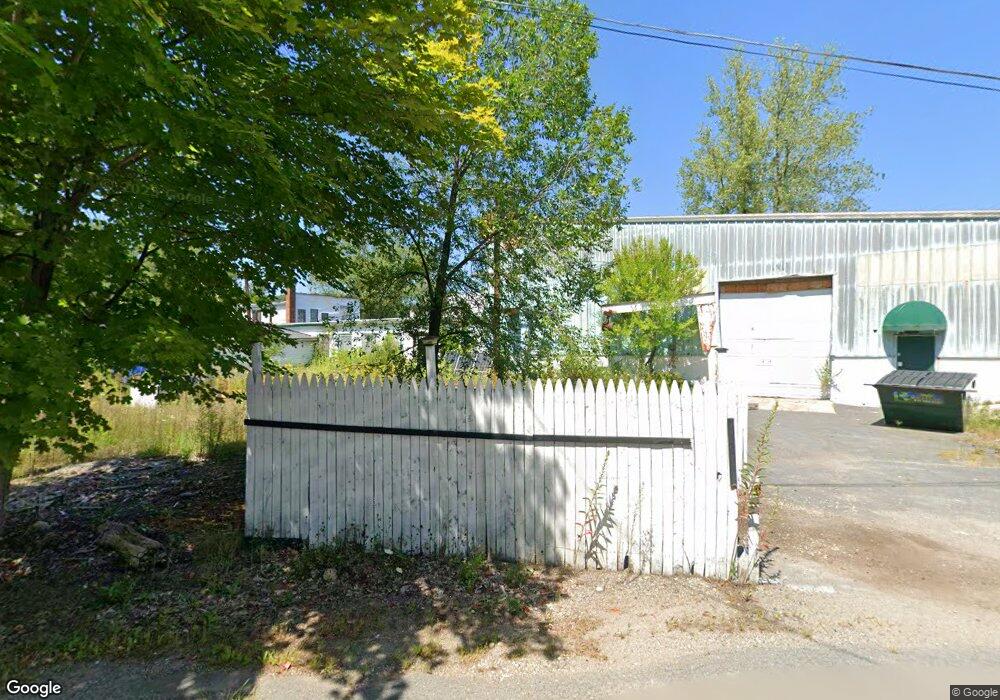
48 E River St Orange, MA 01364
Estimated Value: $537,375
Studio
2
Baths
30,125
Sq Ft
$18/Sq Ft
Est. Value
About This Home
This home is located at 48 E River St, Orange, MA 01364 and is currently estimated at $537,375, approximately $17 per square foot. 48 E River St is a home located in Franklin County with nearby schools including Fisher Hill and Ralph C Mahar Regional School.
Ownership History
Date
Name
Owned For
Owner Type
Purchase Details
Closed on
Sep 17, 2019
Sold by
Orange Technology Center
Bought by
Orange Town Of
Current Estimated Value
Purchase Details
Closed on
Nov 10, 2005
Sold by
Tls Rlty Corp
Bought by
Pump Shop Inc
Home Financials for this Owner
Home Financials are based on the most recent Mortgage that was taken out on this home.
Original Mortgage
$200,000
Interest Rate
5.93%
Mortgage Type
Commercial
Create a Home Valuation Report for This Property
The Home Valuation Report is an in-depth analysis detailing your home's value as well as a comparison with similar homes in the area
Home Values in the Area
Average Home Value in this Area
Purchase History
| Date | Buyer | Sale Price | Title Company |
|---|---|---|---|
| Orange Town Of | $67,500 | -- | |
| Pump Shop Inc | $250,000 | -- | |
| Pump Shop Inc | $250,000 | -- |
Source: Public Records
Mortgage History
| Date | Status | Borrower | Loan Amount |
|---|---|---|---|
| Previous Owner | Pump Shop Inc | $24,000 | |
| Previous Owner | Pump Shop Inc | $200,000 |
Source: Public Records
Tax History
| Year | Tax Paid | Tax Assessment Tax Assessment Total Assessment is a certain percentage of the fair market value that is determined by local assessors to be the total taxable value of land and additions on the property. | Land | Improvement |
|---|---|---|---|---|
| 2025 | $70 | $425,700 | $48,800 | $376,900 |
| 2024 | $7,133 | $409,000 | $48,800 | $360,200 |
| 2023 | $4,973 | $276,900 | $48,800 | $228,100 |
| 2022 | $5,294 | $276,900 | $48,800 | $228,100 |
| 2021 | $4,774 | $238,100 | $50,600 | $187,500 |
| 2020 | $0 | $228,100 | $48,900 | $179,200 |
| 2019 | $5,808 | $257,900 | $95,200 | $162,700 |
| 2018 | $5,397 | $246,000 | $91,500 | $154,500 |
| 2017 | $5,541 | $261,000 | $91,500 | $169,500 |
| 2016 | $5,321 | $245,200 | $91,500 | $153,700 |
| 2015 | $6,005 | $289,100 | $91,500 | $197,600 |
| 2014 | $5,709 | $289,200 | $91,500 | $197,700 |
Source: Public Records
Map
Nearby Homes
Your Personal Tour Guide
Ask me questions while you tour the home.