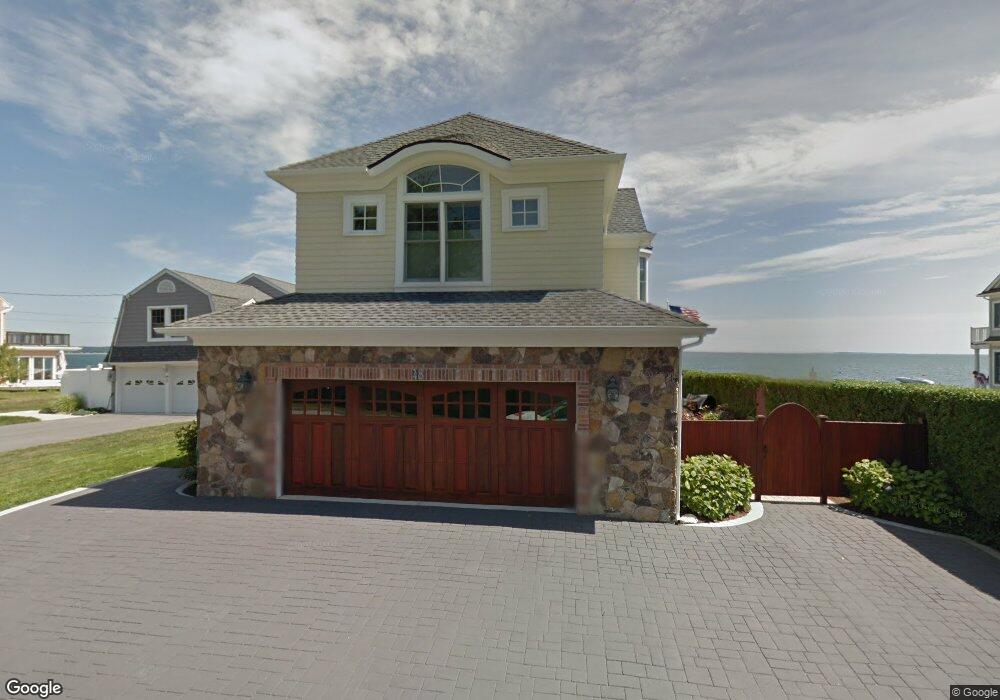
48 E Shore Dr Niantic, CT 06357
Estimated Value: $1,656,000 - $2,503,000
5
Beds
7
Baths
3,180
Sq Ft
$689/Sq Ft
Est. Value
About This Home
This home is located at 48 E Shore Dr, Niantic, CT 06357 and is currently estimated at $2,190,865, approximately $688 per square foot. 48 E Shore Dr is a home located in New London County with nearby schools including East Lyme Middle School, East Lyme High School, and The Light House Voc-Ed Center.
Ownership History
Date
Name
Owned For
Owner Type
Purchase Details
Closed on
Aug 15, 2019
Sold by
Delmastro Joanne
Bought by
Delmastro Daniel
Current Estimated Value
Purchase Details
Closed on
Sep 1, 2009
Sold by
Mdv Dev Llc
Bought by
Delmastro Joanne
Purchase Details
Closed on
Oct 1, 2004
Sold by
Pinch Pamela
Bought by
Mdv Dev Co Llc
Create a Home Valuation Report for This Property
The Home Valuation Report is an in-depth analysis detailing your home's value as well as a comparison with similar homes in the area
Home Values in the Area
Average Home Value in this Area
Purchase History
| Date | Buyer | Sale Price | Title Company |
|---|---|---|---|
| Delmastro Daniel | -- | -- | |
| Delmastro Joanne | $780,000 | -- | |
| Mdv Dev Co Llc | $677,500 | -- |
Source: Public Records
Mortgage History
| Date | Status | Borrower | Loan Amount |
|---|---|---|---|
| Previous Owner | Mdv Dev Co Llc | $199,371 | |
| Previous Owner | Mdv Dev Co Llc | $199,311 |
Source: Public Records
Tax History
| Year | Tax Paid | Tax Assessment Tax Assessment Total Assessment is a certain percentage of the fair market value that is determined by local assessors to be the total taxable value of land and additions on the property. | Land | Improvement |
|---|---|---|---|---|
| 2025 | $28,177 | $1,005,970 | $434,350 | $571,620 |
| 2024 | $26,507 | $1,005,970 | $434,350 | $571,620 |
| 2023 | $25,029 | $1,005,970 | $434,350 | $571,620 |
| 2022 | $23,982 | $1,005,970 | $434,350 | $571,620 |
| 2021 | $22,025 | $772,520 | $376,460 | $396,060 |
| 2020 | $21,827 | $769,650 | $376,460 | $393,190 |
| 2019 | $21,696 | $769,650 | $376,460 | $393,190 |
| 2018 | $21,050 | $769,650 | $376,460 | $393,190 |
| 2017 | $19,103 | $730,240 | $376,460 | $353,780 |
| 2016 | $18,544 | $731,220 | $376,460 | $354,760 |
| 2015 | $18,068 | $731,220 | $376,460 | $354,760 |
| 2014 | $17,571 | $731,220 | $376,460 | $354,760 |
Source: Public Records
Map
Nearby Homes
- 61 Whitecap Rd
- 36 Attawan Rd
- 26 Mohawk Dr
- 127 Black Point Rd Unit 7
- 42 S Washington Ave
- 15 Griswold Rd
- 19 Sapia Dr
- 468 Main St Unit 318
- 468 Main St Unit 111
- 12 Spinnaker Dr
- 43 Village Crossing Unit 43
- 31 Regatta Dr
- 47 Village Crossing Unit 47
- 46 Village Crossing Unit 46
- 185 Main St Unit 301
- 185 Main St Unit 305
- 97 W Main St Unit 36
- 55 Corey Ln
- 43 Roxbury Ct
- 37 Stoneywood Dr
- 46 E Shore Dr
- 1 Sea View Ave
- 01 Seaview Terrace
- 54 E Shore Dr
- 47 E Shore Dr
- 00 Seaview Terrace
- 02 Seaview Terrace
- 2 Sea Breeze Ave
- 53 E Shore Dr
- 3 Sea View Ave
- 4 Sea Breeze Ave
- 4 Sea View Ave
- 5 Sea View Ave
- 56 E Shore Dr
- 40 E Shore Dr
- 9 Sea View Ave
- 6 Sea Breeze Ave
- 6 Sea View Ave
- 55 E Shore Dr
- 7 Sea View Ave
Your Personal Tour Guide
Ask me questions while you tour the home.