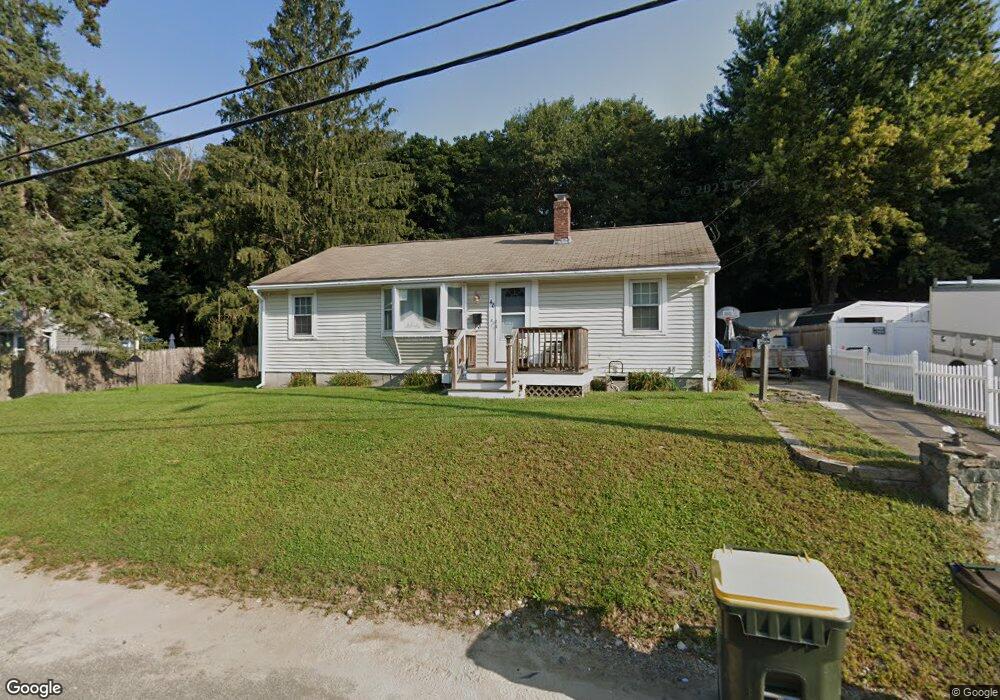
48 Easy St Bellingham, MA 02019
Estimated Value: $396,096 - $468,000
3
Beds
1
Bath
960
Sq Ft
$455/Sq Ft
Est. Value
About This Home
This home is located at 48 Easy St, Bellingham, MA 02019 and is currently estimated at $436,524, approximately $454 per square foot. 48 Easy St is a home located in Norfolk County with nearby schools including Joseph F. DiPietro Elementary, Bellingham High School, and Bethany Christian Academy.
Ownership History
Date
Name
Owned For
Owner Type
Purchase Details
Closed on
Aug 3, 1998
Sold by
Oliver Charlotte V
Bought by
Dechellis Michael and Dechellis Judy
Current Estimated Value
Home Financials for this Owner
Home Financials are based on the most recent Mortgage that was taken out on this home.
Original Mortgage
$127,301
Outstanding Balance
$26,557
Interest Rate
6.92%
Mortgage Type
Purchase Money Mortgage
Estimated Equity
$409,967
Create a Home Valuation Report for This Property
The Home Valuation Report is an in-depth analysis detailing your home's value as well as a comparison with similar homes in the area
Home Values in the Area
Average Home Value in this Area
Purchase History
| Date | Buyer | Sale Price | Title Company |
|---|---|---|---|
| Dechellis Michael | $129,900 | -- |
Source: Public Records
Mortgage History
| Date | Status | Borrower | Loan Amount |
|---|---|---|---|
| Open | Dechellis Michael | $127,301 |
Source: Public Records
Tax History
| Year | Tax Paid | Tax Assessment Tax Assessment Total Assessment is a certain percentage of the fair market value that is determined by local assessors to be the total taxable value of land and additions on the property. | Land | Improvement |
|---|---|---|---|---|
| 2025 | $4,500 | $358,300 | $164,800 | $193,500 |
| 2024 | $4,307 | $334,900 | $150,500 | $184,400 |
| 2023 | $4,098 | $314,000 | $143,300 | $170,700 |
| 2022 | $3,959 | $281,200 | $119,500 | $161,700 |
| 2021 | $3,839 | $266,400 | $119,500 | $146,900 |
| 2020 | $3,578 | $251,600 | $119,500 | $132,100 |
| 2019 | $3,504 | $246,600 | $119,500 | $127,100 |
| 2018 | $3,231 | $224,200 | $114,900 | $109,300 |
| 2017 | $3,166 | $220,800 | $114,900 | $105,900 |
| 2016 | $3,009 | $210,600 | $113,000 | $97,600 |
| 2015 | $2,890 | $202,800 | $108,600 | $94,200 |
| 2014 | $2,900 | $197,800 | $106,100 | $91,700 |
Source: Public Records
Map
Nearby Homes
- 58 Douglas Dr
- 19 Geordan Ave
- 125 Blackstone St
- 67 Blackstone St
- 1 Whitman Cir Unit 1
- 3 Whitman Cir Unit 3
- 5 Whitman Cir Unit 5
- 0 North St Unit 73440626
- 1501 Old Bridge Ln Unit 1501
- 3003 Maple Brook Rd Unit 3003
- 1 Evergreen Dr Unit 1
- 31 Bellwood Cir Unit 31B
- 34 Bellwood Cir Unit 34
- 23 Bellwood Cir Unit 23
- 7 Palmetto Dr Unit 7
- 123-125 Mendon St
- 352 Lake St
- 5 Bernier Ln
- 36 Indian Run Rd
- 11 Quail Run Rd
Your Personal Tour Guide
Ask me questions while you tour the home.