Estimated Value: $3,738,000 - $5,501,659
5
Beds
6
Baths
10,150
Sq Ft
$455/Sq Ft
Est. Value
About This Home
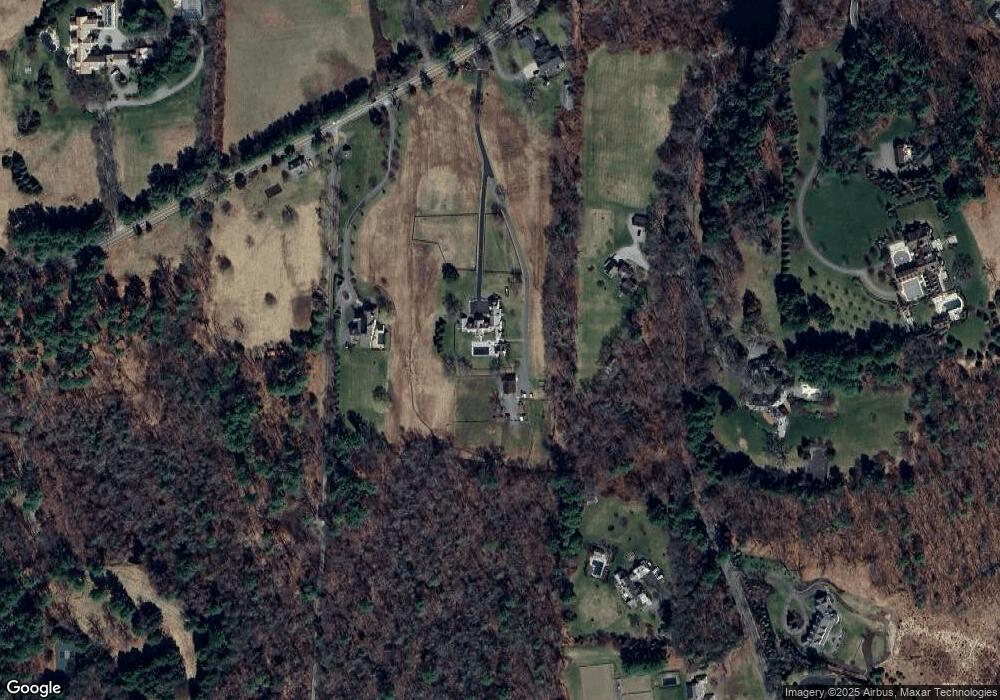
This home is located at 48 Farm St, Dover, MA 02030 and is currently estimated at $4,619,830, approximately $455 per square foot. 48 Farm St is a home located in Norfolk County with nearby schools including Chickering Elementary School, Dover-Sherborn Regional Middle School, and Dover-Sherborn Regional High School.
Ownership History
Date
Name
Owned For
Owner Type
Purchase Details
Closed on
Jan 10, 2014
Sold by
Sheldon Jane M Est
Bought by
Sipp Thomas M and Sipp Sharon G
Current Estimated Value
Home Financials for this Owner
Home Financials are based on the most recent Mortgage that was taken out on this home.
Original Mortgage
$1,470,000
Outstanding Balance
$1,047,773
Interest Rate
3%
Mortgage Type
Purchase Money Mortgage
Estimated Equity
$3,572,057
Create a Home Valuation Report for This Property
The Home Valuation Report is an in-depth analysis detailing your home's value as well as a comparison with similar homes in the area
Home Values in the Area
Average Home Value in this Area
Purchase History
| Date | Buyer | Sale Price | Title Company |
|---|---|---|---|
| Sipp Thomas M | $2,100,000 | -- |
Source: Public Records
Mortgage History
| Date | Status | Borrower | Loan Amount |
|---|---|---|---|
| Open | Sipp Thomas M | $1,470,000 |
Source: Public Records
Tax History
| Year | Tax Paid | Tax Assessment Tax Assessment Total Assessment is a certain percentage of the fair market value that is determined by local assessors to be the total taxable value of land and additions on the property. | Land | Improvement |
|---|---|---|---|---|
| 2025 | $47,596 | $4,223,271 | $928,471 | $3,294,800 |
| 2024 | $45,169 | $4,121,245 | $928,245 | $3,193,000 |
| 2023 | $41,475 | $3,402,342 | $805,442 | $2,596,900 |
| 2022 | $42,086 | $3,388,582 | $791,682 | $2,596,900 |
| 2021 | $45,272 | $3,512,193 | $792,493 | $2,719,700 |
| 2020 | $46,919 | $3,654,093 | $792,493 | $2,861,600 |
| 2019 | $53,800 | $4,160,900 | $1,299,300 | $2,861,600 |
| 2018 | $49,483 | $3,853,800 | $1,217,700 | $2,636,100 |
| 2017 | $51,056 | $3,912,300 | $1,152,300 | $2,760,000 |
| 2016 | $27,661 | $2,147,600 | $1,163,200 | $984,400 |
| 2015 | $21,593 | $1,700,200 | $1,274,800 | $425,400 |
Source: Public Records
Map
Nearby Homes
Your Personal Tour Guide
Ask me questions while you tour the home.