Estimated Value: $1,311,000 - $1,406,000
4
Beds
3
Baths
2,150
Sq Ft
$632/Sq Ft
Est. Value
About This Home
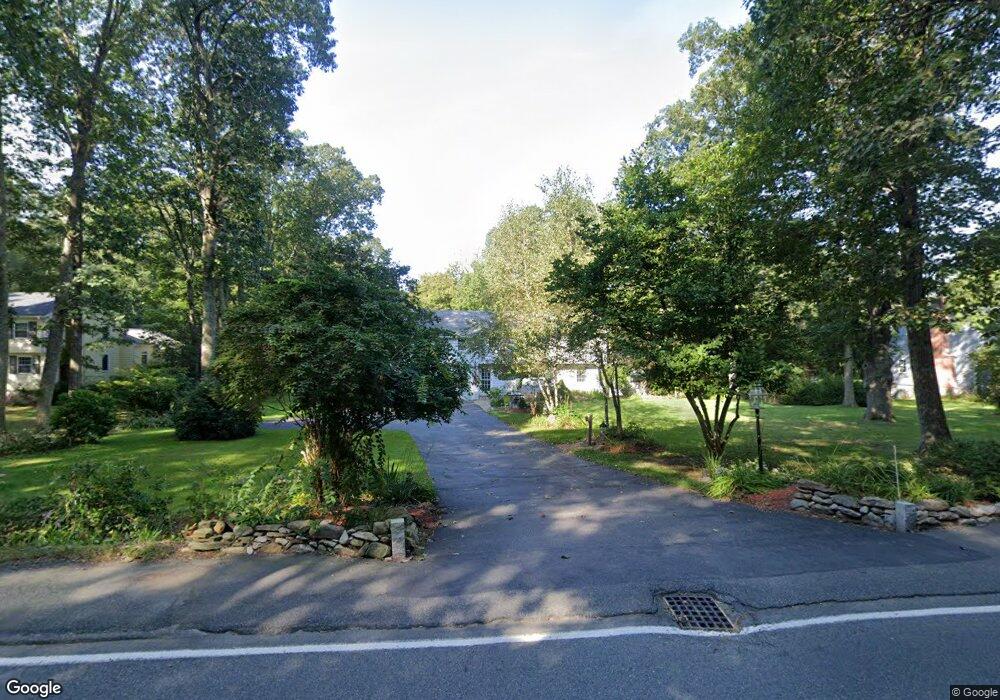
This home is located at 48 Glen St, Dover, MA 02030 and is currently estimated at $1,357,947, approximately $631 per square foot. 48 Glen St is a home located in Norfolk County with nearby schools including Chickering Elementary School, Dover-Sherborn Regional Middle School, and Dover-Sherborn Regional High School.
Ownership History
Date
Name
Owned For
Owner Type
Purchase Details
Closed on
Aug 3, 2005
Sold by
King James C
Bought by
Fagan Brandon J and Fagan Karen N J
Current Estimated Value
Home Financials for this Owner
Home Financials are based on the most recent Mortgage that was taken out on this home.
Original Mortgage
$330,000
Outstanding Balance
$173,019
Interest Rate
5.63%
Mortgage Type
Purchase Money Mortgage
Estimated Equity
$1,184,928
Purchase Details
Closed on
Nov 13, 1998
Sold by
Breslin Evalynne L
Bought by
King James C
Home Financials for this Owner
Home Financials are based on the most recent Mortgage that was taken out on this home.
Original Mortgage
$331,200
Interest Rate
6.65%
Mortgage Type
Purchase Money Mortgage
Create a Home Valuation Report for This Property
The Home Valuation Report is an in-depth analysis detailing your home's value as well as a comparison with similar homes in the area
Home Values in the Area
Average Home Value in this Area
Purchase History
| Date | Buyer | Sale Price | Title Company |
|---|---|---|---|
| Fagan Brandon J | $690,000 | -- | |
| King James C | $414,000 | -- |
Source: Public Records
Mortgage History
| Date | Status | Borrower | Loan Amount |
|---|---|---|---|
| Open | King James C | $40,000 | |
| Open | Fagan Brandon J | $330,000 | |
| Previous Owner | King James C | $331,200 |
Source: Public Records
Tax History
| Year | Tax Paid | Tax Assessment Tax Assessment Total Assessment is a certain percentage of the fair market value that is determined by local assessors to be the total taxable value of land and additions on the property. | Land | Improvement |
|---|---|---|---|---|
| 2025 | $12,600 | $1,118,000 | $644,300 | $473,700 |
| 2024 | $11,441 | $1,043,900 | $600,800 | $443,100 |
| 2023 | $11,020 | $904,000 | $524,300 | $379,700 |
| 2022 | $10,117 | $814,600 | $480,800 | $333,800 |
| 2021 | $9,470 | $734,700 | $415,400 | $319,300 |
| 2020 | $9,434 | $734,700 | $415,400 | $319,300 |
| 2019 | $9,500 | $734,700 | $415,400 | $319,300 |
| 2018 | $9,174 | $714,500 | $415,400 | $299,100 |
| 2017 | $8,734 | $669,300 | $361,000 | $308,300 |
| 2016 | $8,480 | $658,400 | $350,100 | $308,300 |
| 2015 | $8,470 | $666,900 | $382,800 | $284,100 |
Source: Public Records
Map
Nearby Homes
Your Personal Tour Guide
Ask me questions while you tour the home.