E
Seller's Agent in 2025
Erin Anderson
Anderson Realty Partners
(617) 548-5443
4 in this area
36 Total Sales
Estimated Value: $614,000 - $652,000
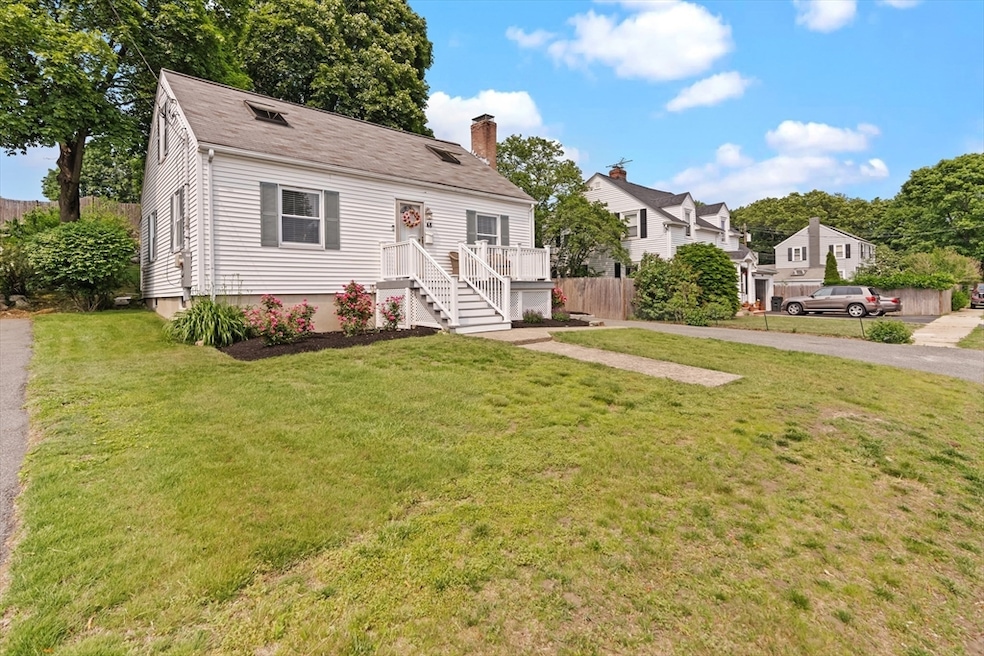
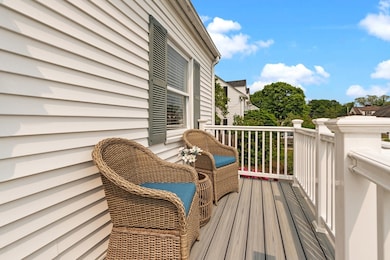
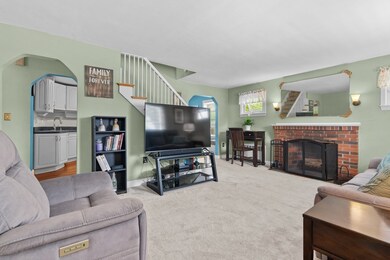
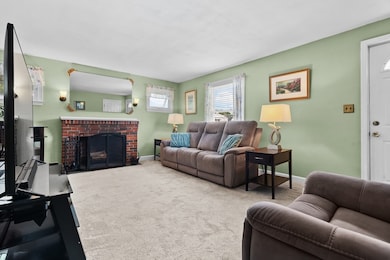
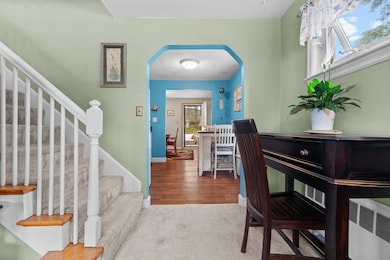
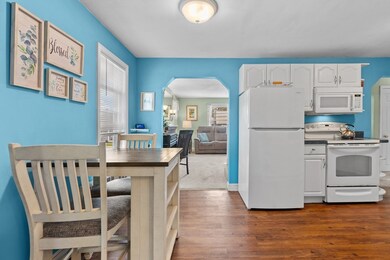
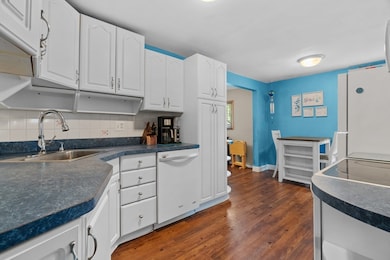
Charming cape in a great Stoneham neighborhood, close to beautiful Spot Pond, the Middlesex Fells, Stone Zoo and easy highway access. Private lot with rear patio perfect for entertaining or just relaxing, naturally shaded by a stunning mature tree. Desirable first floor bedroom, bathroom and laundry room. Welcoming living room with brick fireplace, eat-in kitchen, and additional dining and office space complete the first floor. Skylights on the spacious second floor, with extra storage and expansion possibilities. Updates include a heating system less than five years old, and a new front porch within the last year. Don't miss the opportunity to become a part of the Stoneham community, complete with a brand new high school, and all this location has to offer.
| Date | Buyer | Sale Price | Title Company |
|---|---|---|---|
| Rami Achraf | $650,000 | -- | |
| Rami Achraf | $650,000 | -- | |
| Mullowney Scott J | $129,500 | -- | |
| Mullowney Scott J | $129,500 | -- |
| Date | Status | Borrower | Loan Amount |
|---|---|---|---|
| Open | Rami Achraf | $508,000 | |
| Closed | Rami Achraf | $508,000 | |
| Previous Owner | Mullowney Scott J | $160,050 | |
| Previous Owner | Mullowney Scott J | $192,000 | |
| Previous Owner | Mullowney Scott J | $20,000 |
| Date | Event | Price | List to Sale | Price per Sq Ft |
|---|---|---|---|---|
| 07/18/2025 07/18/25 | Sold | $635,000 | +1.0% | $429 / Sq Ft |
| 06/11/2025 06/11/25 | Pending | -- | -- | -- |
| 06/05/2025 06/05/25 | For Sale | $628,900 | -- | $425 / Sq Ft |
| Year | Tax Paid | Tax Assessment Tax Assessment Total Assessment is a certain percentage of the fair market value that is determined by local assessors to be the total taxable value of land and additions on the property. | Land | Improvement |
|---|---|---|---|---|
| 2025 | $5,634 | $550,700 | $347,700 | $203,000 |
| 2024 | $5,408 | $510,700 | $320,200 | $190,500 |
| 2023 | $5,228 | $471,000 | $292,800 | $178,200 |
| 2022 | $4,499 | $432,200 | $265,300 | $166,900 |
| 2021 | $7,042 | $420,900 | $256,200 | $164,700 |
| 2020 | $4,354 | $403,500 | $242,500 | $161,000 |
| 2019 | $4,489 | $400,100 | $233,000 | $167,100 |
| 2018 | $6,054 | $371,600 | $206,500 | $165,100 |
| 2017 | $5,885 | $339,800 | $190,100 | $149,700 |
| 2016 | $3,943 | $310,500 | $190,100 | $120,400 |
| 2015 | $3,765 | $290,500 | $181,400 | $109,100 |
| 2014 | $4,038 | $299,300 | $172,800 | $126,500 |
E
Seller's Agent in 2025
Erin Anderson
Anderson Realty Partners
(617) 548-5443
4 in this area
36 Total Sales

Seller Co-Listing Agent in 2025
Tom Anderson
Anderson Realty Partners
(781) 589-7314
6 in this area
50 Total Sales
Source: MLS Property Information Network (MLS PIN)
MLS Number: 73386535
APN: STON-000014-000000-000231
Disclaimer: Certain information contained herein is derived from information provided by parties other than Homes.com. All information provided is deemed reliable, but is not guaranteed to be accurate and should be independently verified.
![]() The property listing data and information, or the Images, set forth herein were provided to MLS Property Information Network, Inc. from third party sources, including sellers, lessors and public records, and were compiled by MLS Property Information Network, Inc. The property listing data and information, and the Images, are for the personal, non-commercial use of consumers having a good faith interest in purchasing or leasing listed properties of the type displayed to them and may not be used for any purpose other than to identify prospective properties which such consumers may have a good faith interest in purchasing or leasing. MLS Property Information Network, Inc. and its subscribers disclaim any and all representations and warranties as to the accuracy of the property listing data and information, or as to the accuracy of any of the Images, set forth herein.
The property listing data and information, or the Images, set forth herein were provided to MLS Property Information Network, Inc. from third party sources, including sellers, lessors and public records, and were compiled by MLS Property Information Network, Inc. The property listing data and information, and the Images, are for the personal, non-commercial use of consumers having a good faith interest in purchasing or leasing listed properties of the type displayed to them and may not be used for any purpose other than to identify prospective properties which such consumers may have a good faith interest in purchasing or leasing. MLS Property Information Network, Inc. and its subscribers disclaim any and all representations and warranties as to the accuracy of the property listing data and information, or as to the accuracy of any of the Images, set forth herein.
Ask me questions while you tour the home.