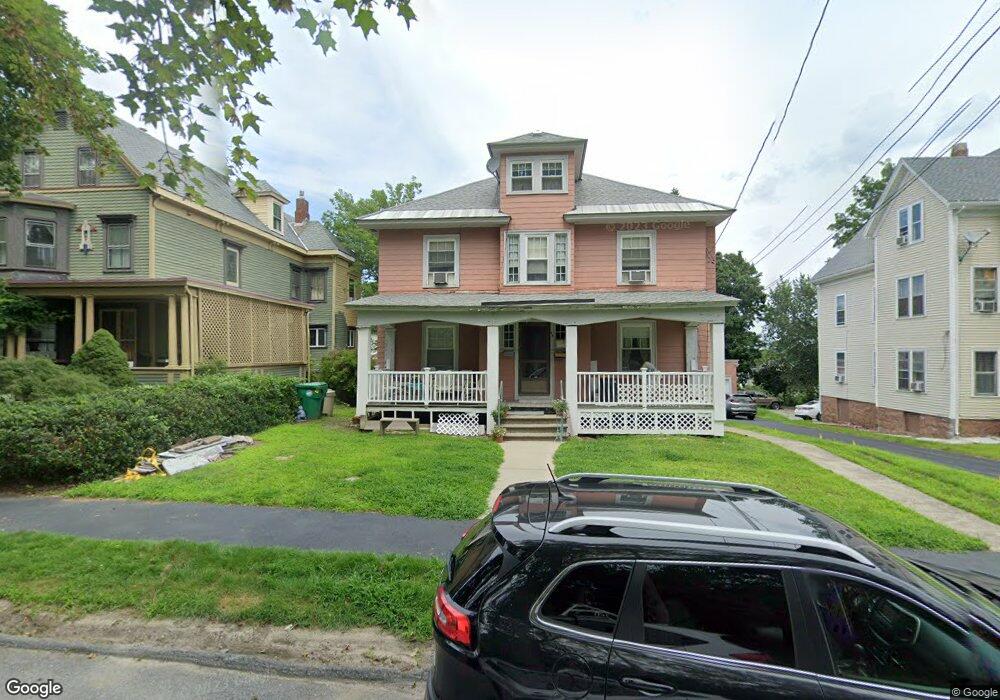
48 Haskell Ave Clinton, MA 01510
Estimated Value: $601,000 - $660,000
6
Beds
2
Baths
3,300
Sq Ft
$191/Sq Ft
Est. Value
About This Home
This home is located at 48 Haskell Ave, Clinton, MA 01510 and is currently estimated at $630,443, approximately $191 per square foot. 48 Haskell Ave is a home located in Worcester County with nearby schools including Clinton Elementary School, Clinton Senior High School, and Clinton Middle School.
Ownership History
Date
Name
Owned For
Owner Type
Purchase Details
Closed on
Nov 29, 2011
Sold by
Bazydlo Wanda J and Bazydlo Bruce J
Bought by
Bazydlo Bruce J and Bazydlo Debra M
Current Estimated Value
Home Financials for this Owner
Home Financials are based on the most recent Mortgage that was taken out on this home.
Original Mortgage
$105,000
Outstanding Balance
$11,429
Interest Rate
4.12%
Mortgage Type
Purchase Money Mortgage
Estimated Equity
$619,014
Create a Home Valuation Report for This Property
The Home Valuation Report is an in-depth analysis detailing your home's value as well as a comparison with similar homes in the area
Home Values in the Area
Average Home Value in this Area
Purchase History
| Date | Buyer | Sale Price | Title Company |
|---|---|---|---|
| Bazydlo Bruce J | -- | -- |
Source: Public Records
Mortgage History
| Date | Status | Borrower | Loan Amount |
|---|---|---|---|
| Open | Bazydlo Bruce J | $105,000 |
Source: Public Records
Tax History Compared to Growth
Tax History
| Year | Tax Paid | Tax Assessment Tax Assessment Total Assessment is a certain percentage of the fair market value that is determined by local assessors to be the total taxable value of land and additions on the property. | Land | Improvement |
|---|---|---|---|---|
| 2025 | $7,197 | $541,100 | $127,700 | $413,400 |
| 2024 | $6,925 | $527,000 | $127,700 | $399,300 |
| 2023 | $6,188 | $462,800 | $116,200 | $346,600 |
| 2022 | $6,167 | $413,600 | $105,600 | $308,000 |
| 2021 | $5,391 | $338,200 | $100,600 | $237,600 |
| 2020 | $5,132 | $331,300 | $100,600 | $230,700 |
| 2019 | $4,825 | $302,900 | $97,600 | $205,300 |
| 2018 | $4,546 | $267,700 | $93,700 | $174,000 |
| 2017 | $4,518 | $255,700 | $93,700 | $162,000 |
| 2016 | $4,492 | $260,100 | $93,700 | $166,400 |
| 2015 | $4,198 | $252,000 | $91,000 | $161,000 |
| 2014 | $4,070 | $252,000 | $91,000 | $161,000 |
Source: Public Records
Map
Nearby Homes
- 89 1/2 Walnut St
- 346 Oak St
- 525 Water St
- 118 Chace St
- 57 Clark St
- 38 Norman St
- 55 Sterling St Unit 306
- 55 Sterling St Unit 314
- 40 Nashua St Unit 5
- 119 Clark St
- 125 Grove St
- 109 Oak St
- 18 Eagle Nest Unit 331
- 78 Oak St Unit 78
- 403 Main St
- 4 Jackie Way
- 70 Oak St Unit 70
- 13 Simon Ct
- 6 Worcester St
- 4 Worcester St