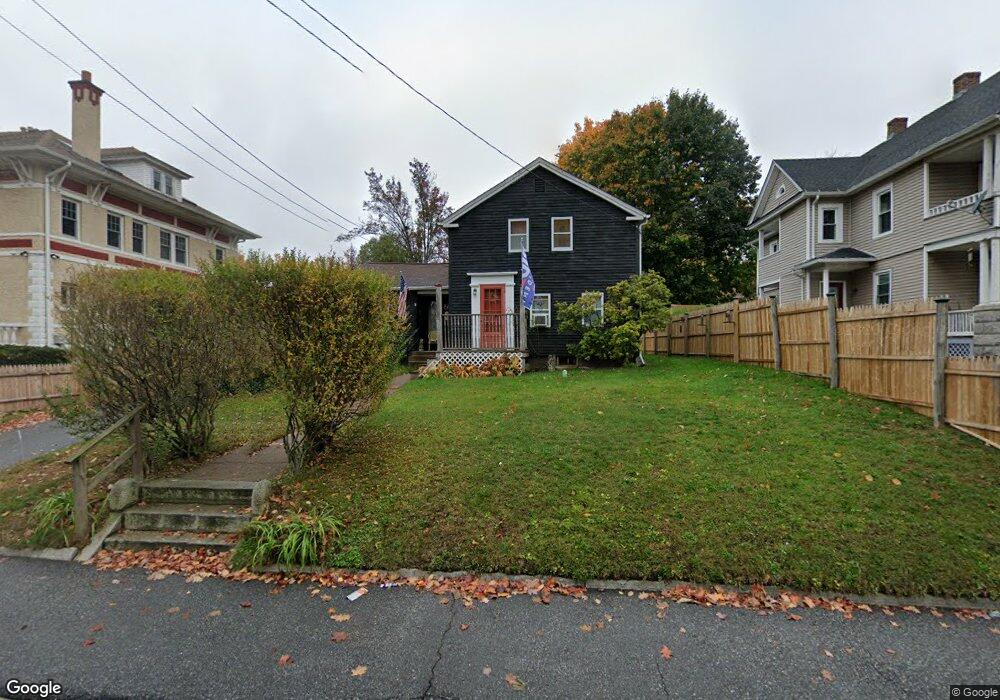
48 High St Torrington, CT 06790
Estimated Value: $209,000 - $253,000
3
Beds
1
Bath
1,235
Sq Ft
$188/Sq Ft
Est. Value
About This Home
This home is located at 48 High St, Torrington, CT 06790 and is currently estimated at $231,773, approximately $187 per square foot. 48 High St is a home located in Litchfield County with nearby schools including Torrington Middle School, Torrington High School, and St. John Paul the Great Academy.
Ownership History
Date
Name
Owned For
Owner Type
Purchase Details
Closed on
Oct 29, 1993
Sold by
Dimauro Sebastian J
Bought by
Cunningham John B and Cunningham Kathleen A
Current Estimated Value
Home Financials for this Owner
Home Financials are based on the most recent Mortgage that was taken out on this home.
Original Mortgage
$73,150
Interest Rate
7.5%
Mortgage Type
Unknown
Purchase Details
Closed on
May 27, 1993
Sold by
Demauro Richard J
Bought by
Demauro Sebastian
Home Financials for this Owner
Home Financials are based on the most recent Mortgage that was taken out on this home.
Original Mortgage
$62,000
Interest Rate
6%
Mortgage Type
Unknown
Create a Home Valuation Report for This Property
The Home Valuation Report is an in-depth analysis detailing your home's value as well as a comparison with similar homes in the area
Home Values in the Area
Average Home Value in this Area
Purchase History
| Date | Buyer | Sale Price | Title Company |
|---|---|---|---|
| Cunningham John B | $77,000 | -- | |
| Demauro Sebastian | $77,500 | -- |
Source: Public Records
Mortgage History
| Date | Status | Borrower | Loan Amount |
|---|---|---|---|
| Closed | Demauro Sebastian | $96,572 | |
| Closed | Demauro Sebastian | $73,150 | |
| Previous Owner | Demauro Sebastian | $62,000 |
Source: Public Records
Tax History
| Year | Tax Paid | Tax Assessment Tax Assessment Total Assessment is a certain percentage of the fair market value that is determined by local assessors to be the total taxable value of land and additions on the property. | Land | Improvement |
|---|---|---|---|---|
| 2025 | $5,477 | $142,450 | $20,160 | $122,290 |
| 2024 | $3,634 | $75,760 | $20,160 | $55,600 |
| 2023 | $3,633 | $75,760 | $20,160 | $55,600 |
| 2022 | $3,501 | $74,260 | $20,160 | $54,100 |
| 2021 | $3,417 | $74,000 | $20,160 | $53,840 |
| 2020 | $3,417 | $74,000 | $20,160 | $53,840 |
| 2019 | $2,902 | $62,860 | $20,160 | $42,700 |
| 2018 | $2,902 | $62,860 | $20,160 | $42,700 |
| 2017 | $2,876 | $62,860 | $20,160 | $42,700 |
| 2016 | $2,876 | $62,860 | $20,160 | $42,700 |
| 2015 | $2,876 | $62,860 | $20,160 | $42,700 |
| 2014 | $3,581 | $98,590 | $41,120 | $57,470 |
Source: Public Records
Map
Nearby Homes
- 329 Church St
- 80 Washington Ave
- 116 High St
- 115 Beechwood Ave
- 154 High St
- 30 Culvert St
- 163 Beechwood Ave
- 146 Beechwood Ave
- 108 Culvert St
- 121 Culvert St
- 00 Church St
- 231 Beechwood Ave
- 42 Pulver St
- 60 Guilford St
- 0 Highland Ave Unit 24088105
- 118 Pearl St
- 253 Riverside Ave
- 72 French St
- 47 Whiting Ave
- 444 Prospect St