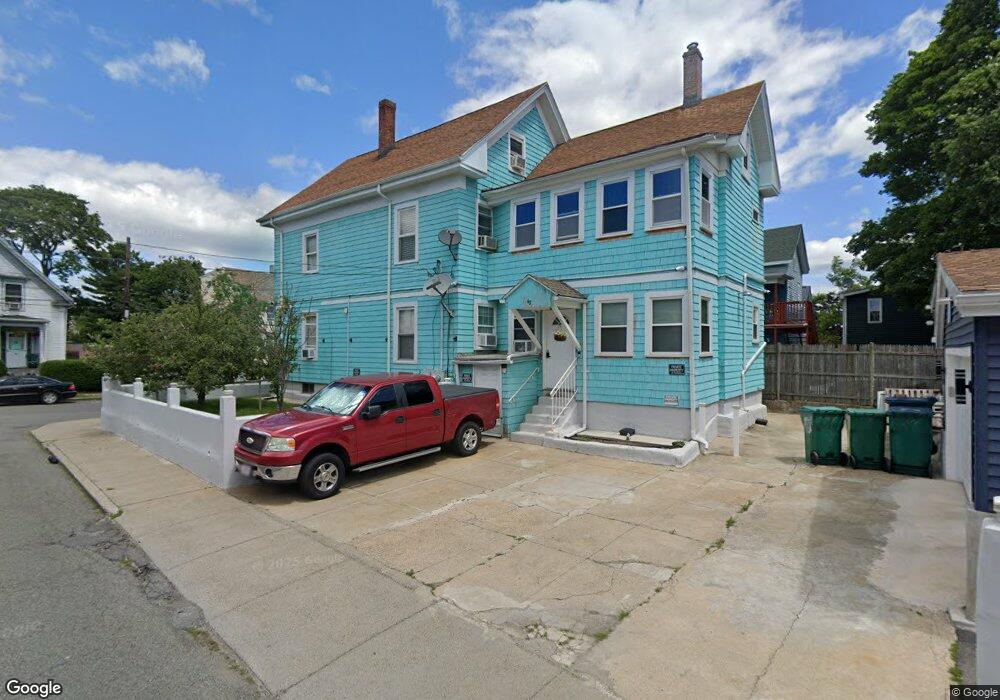
48 Ingalls St Lynn, MA 01902
Fayette Street NeighborhoodEstimated Value: $769,891 - $917,000
5
Beds
3
Baths
2,913
Sq Ft
$288/Sq Ft
Est. Value
About This Home
This home is located at 48 Ingalls St, Lynn, MA 01902 and is currently estimated at $838,973, approximately $288 per square foot. 48 Ingalls St is a home located in Essex County with nearby schools including Ingalls Elementary School, William R. Fallon School, and Marshall Middle School.
Ownership History
Date
Name
Owned For
Owner Type
Purchase Details
Closed on
Sep 16, 2008
Sold by
Wachovia Bk
Bought by
Diaz Juan
Current Estimated Value
Home Financials for this Owner
Home Financials are based on the most recent Mortgage that was taken out on this home.
Original Mortgage
$208,170
Interest Rate
6.58%
Mortgage Type
Purchase Money Mortgage
Purchase Details
Closed on
Jun 20, 2008
Sold by
Betances Pedro A and Wachovia Bk
Bought by
Wachovia Bk
Purchase Details
Closed on
May 23, 2000
Sold by
Pazdziorny Zbigniew and Pazdziorny Karina
Bought by
Betances Pedro A and Diaz Nelly I
Purchase Details
Closed on
May 30, 1991
Sold by
Blomster William A
Bought by
Pazdziorny Zbigniew
Create a Home Valuation Report for This Property
The Home Valuation Report is an in-depth analysis detailing your home's value as well as a comparison with similar homes in the area
Home Values in the Area
Average Home Value in this Area
Purchase History
| Date | Buyer | Sale Price | Title Company |
|---|---|---|---|
| Diaz Juan | $212,000 | -- | |
| Diaz Juan | $212,000 | -- | |
| Wachovia Bk | $194,376 | -- | |
| Wachovia Bk | $194,376 | -- | |
| Betances Pedro A | $162,000 | -- | |
| Betances Pedro A | $162,000 | -- | |
| Pazdziorny Zbigniew | $100,000 | -- | |
| Pazdziorny Zbigniew | $100,000 | -- |
Source: Public Records
Mortgage History
| Date | Status | Borrower | Loan Amount |
|---|---|---|---|
| Open | Pazdziorny Zbigniew | $210,576 | |
| Closed | Pazdziorny Zbigniew | $208,170 |
Source: Public Records
Tax History Compared to Growth
Tax History
| Year | Tax Paid | Tax Assessment Tax Assessment Total Assessment is a certain percentage of the fair market value that is determined by local assessors to be the total taxable value of land and additions on the property. | Land | Improvement |
|---|---|---|---|---|
| 2025 | $7,674 | $740,689 | $184,200 | $556,489 |
| 2024 | $7,273 | $690,700 | $175,100 | $515,600 |
| 2023 | $7,128 | $639,300 | $159,400 | $479,900 |
| 2022 | $7,209 | $580,000 | $136,400 | $443,600 |
| 2021 | $6,752 | $518,200 | $129,000 | $389,200 |
| 2020 | $6,244 | $466,000 | $119,900 | $346,100 |
| 2019 | $5,917 | $413,800 | $103,400 | $310,400 |
| 2018 | $5,409 | $357,000 | $95,600 | $261,400 |
| 2017 | $5,184 | $332,300 | $89,500 | $242,800 |
| 2016 | $4,707 | $290,900 | $76,900 | $214,000 |
| 2015 | $4,397 | $262,500 | $73,000 | $189,500 |
Source: Public Records
Map
Nearby Homes
- 24 Mckinley Terrace
- 30 Clifton Ave
- 175 Essex St
- 14 Jewetts Ct
- 17 Collins St
- 249 Chatham St
- 129 Williams Ave
- 33 Jackson St Unit 303
- 33A Jackson St Unit 100
- 248 Essex St
- 82 Fayette St
- 26 Groveland St
- 12 Chestnut Ave
- 59 Essex St Unit 59B
- 24 Parrott St
- 6 Washburn St
- 329 Essex St
- 44 Eutaw Ave
- 48 Eutaw Ave
- 30 Adams St