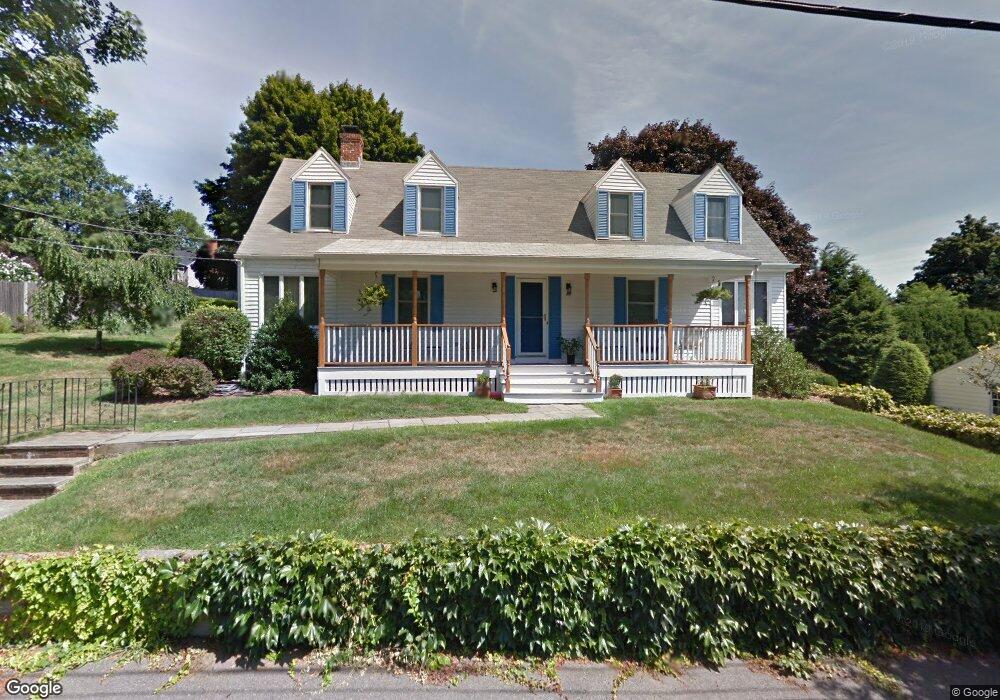
48 Kenneth Rd Marblehead, MA 01945
Estimated Value: $1,125,000 - $1,445,000
4
Beds
3
Baths
3,236
Sq Ft
$389/Sq Ft
Est. Value
About This Home
This home is located at 48 Kenneth Rd, Marblehead, MA 01945 and is currently estimated at $1,258,368, approximately $388 per square foot. 48 Kenneth Rd is a home located in Essex County with nearby schools including Marblehead High School, Marblehead Community Charter Public School, and Tower School.
Ownership History
Date
Name
Owned For
Owner Type
Purchase Details
Closed on
May 31, 2018
Sold by
Flanagan J Stephen J and Flanagan Monica T
Bought by
Robert M Dibbs Lt
Current Estimated Value
Purchase Details
Closed on
May 30, 1989
Sold by
Cross Charles
Bought by
Flanagan J Stephen
Create a Home Valuation Report for This Property
The Home Valuation Report is an in-depth analysis detailing your home's value as well as a comparison with similar homes in the area
Home Values in the Area
Average Home Value in this Area
Purchase History
We collect this data history from publicly available records. To have your information removed, we recommend requesting removal directly through your county’s website.
| Date | Buyer | Sale Price | Title Company |
|---|---|---|---|
| Robert M Dibbs Lt | $740,000 | -- | |
| Robert M Dibbs Lt | $740,000 | -- | |
| Flanagan J Stephen | $276,000 | -- | |
| Flanagan J Stephen | $276,000 | -- |
Source: Public Records
Mortgage History
We collect this data history from publicly available records. To have your information removed, we recommend requesting removal directly through your county’s website.
| Date | Status | Borrower | Loan Amount |
|---|---|---|---|
| Previous Owner | Flanagan J Stephen | $272,000 | |
| Previous Owner | Flanagan J Stephen | $290,000 | |
| Previous Owner | Flanagan J Stephen | $203,150 | |
| Previous Owner | Flanagan J Stephen | $217,000 |
Source: Public Records
Tax History
| Year | Tax Paid | Tax Assessment Tax Assessment Total Assessment is a certain percentage of the fair market value that is determined by local assessors to be the total taxable value of land and additions on the property. | Land | Improvement |
|---|---|---|---|---|
| 2025 | $9,385 | $1,037,000 | $530,000 | $507,000 |
| 2024 | $8,035 | $896,800 | $569,800 | $327,000 |
| 2023 | $8,580 | $858,000 | $496,900 | $361,100 |
| 2022 | $8,364 | $795,100 | $437,300 | $357,800 |
| 2021 | $8,146 | $781,800 | $424,000 | $357,800 |
| 2020 | $7,465 | $718,500 | $410,800 | $307,700 |
| 2019 | $7,397 | $688,700 | $384,300 | $304,400 |
| 2018 | $7,443 | $675,400 | $371,000 | $304,400 |
| 2017 | $6,999 | $635,700 | $331,300 | $304,400 |
| 2016 | $6,762 | $609,200 | $304,800 | $304,400 |
| 2015 | $6,385 | $576,300 | $291,500 | $284,800 |
| 2014 | $5,878 | $530,000 | $251,800 | $278,200 |
Source: Public Records
Map
Nearby Homes
- 69 Kenneth Rd
- 16 Liberty Rd
- 155 Green St Unit 4
- 23 Whittier Rd
- 5 Ramsay Rd
- 55 Lincoln Ave
- 55 Stony Brook Rd
- 4 Broadmere Way
- 78 Garfield St
- 197A W Shore Dr Unit A
- 16 Evans Rd Unit 2
- 149 Elm St
- 9 Mount Vernon St
- 31 Mugford St
- 13 Elm St Unit 13A
- 20 Mechanic Square Unit 2
- 20 Mechanic Square Unit 3
- 45 Pleasant St
- 64 Pleasant St Unit A
- 44 Pleasant St Unit 1
Your Personal Tour Guide
Ask me questions while you tour the home.